Profiling a .NET6 app running on AWS ECS Fargate with dotnet-monitor
Just show me the code
As always, if you don’t care about the post I have uploaded the source code on my Github.
I’m pretty confident that everyone at some time or other has stumbled with an application that performs well on your local machine, maybe even on the dev environments, but when you put it on production it begins to perform poorly, and it becomes an ordeal trying to pinpoint the root cause of the problem.
In my previous post I talked about how to profile a .NET6 application using the .NET CLI diagnostic tools.
Those tools (dotnet-counters, dotnet-dump, dotnet-gcdump and dotnet-trace) are designed to work in a wide variety of environments.
If your apps are running on a VM you can add them on the base image or connect remotely to the machine via SSH and install them.
If you’re running on some sort of Kubernetes cluster you can bake them inside the docker image and afterwards connect to the pod using the kubectl command line.
There are even some Cloud Services, like Azure App Services, that uses its own set of diagnostic tools, so you don’t need them at all.
Nonetheless there are some environments where collecting diagnostics can become cumbersome, for profiling an app in these kind of environments you can use the dotnet-monitor tool.
AWS ECS Fargate is one of this environments. Fargate is a serverless container platform, it is a general-purpose platform, which means it doesn’t have a specialized set of diagnostic tools put in place like Azure App Service, and trying to access a running container to execute the .NET CLI diagnostic tools is doable but is an absolute pain in the ass.
Fargate is a great example where the dotnet-monitor tool becomes really handy when we want to profile a .NET app running on it.
This post is more oriented towards the necessary steps to deploy a .NET6 application on AWS ECS Fargate with dotnet-monitor as a sidecar container rather than how to profile an app.
But nonetheless after setting everything up on the AWS side I plan to briefly show you how to use the dotnet-monitor HTTP API to profile an app.
dotnet-monitor
dotnet monitor provides an unified way to collect traces, memory dumps, gc dumps and metrics.
It exposes an HTTP API for on demand collection of artifacts with the following endpoints:
/processes: Gets detailed information about discoverable processes./dump: Captures managed dumps of processes without using a debugger./gcdump: Captures GC dumps of processes./trace: Captures traces of processes without using a profiler./metrics: Captures a snapshot of metrics of the default process in the Prometheus exposition format./livemetrics: Captures live streaming metrics of a process./logs: Captures logs of processes./infoGets info about dotnet monitor./operations: Gets egress operation status or cancels operations.
To put it simply, dotnet-monitor just exposes the .NET CLI diagnostics tools via an HTTP API.
Right now, it is available via two different distribution mechanisms:
- As a .NET Core global tool.
- As a container image available via the Microsoft Container Registry (MCR).
dotnet-monitor is not only for running on-demand profiling, it can also be configured to automatically collect diagnostic artifacts when certain conditions are met within a process. For example, collect a CPU dump when you have a sustained high CPU during a period of time.
Demo Application
The application I’m going to use is the same one I used on my previous post.
The demo app is a .NET 6 API with 3 endpoints:
/blocking-threadsendpoint./high-cpuendpoint./memory-leakendpoint.
Each endpoint has a different performance issue and the problems are pretty self-explanatory.
But first of all, we need to deploy the app into AWS ECS Fargate with dotnet-monitor as a sidecar container.
Deploy into AWS ECS Fargate
This is the entire stack that we’re going to deploy on AWS:
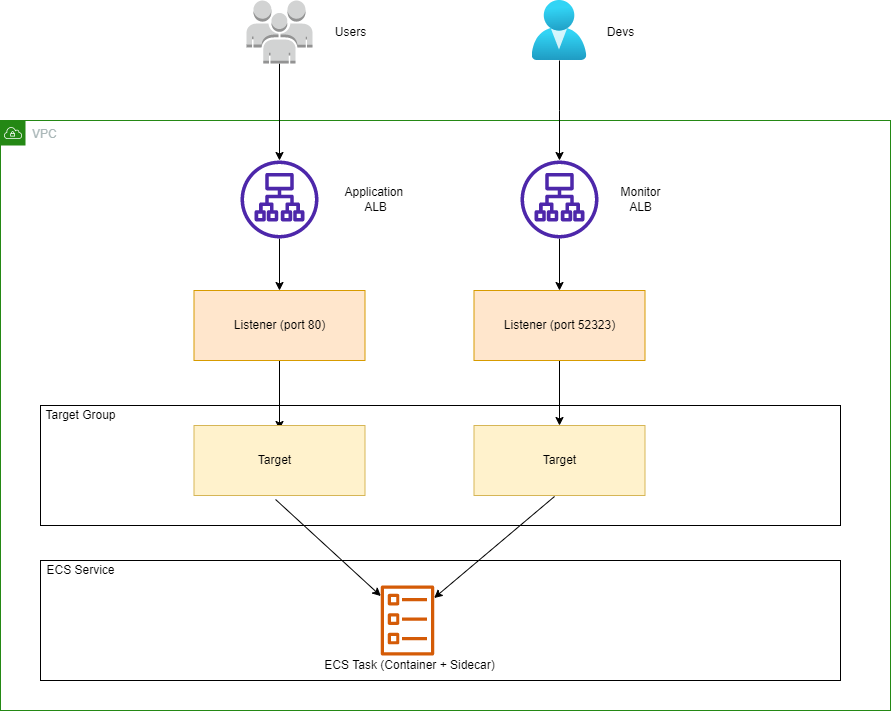
- A VPC with 2 public Subnets.
- A public Application Load Balancer that listens on port 80.
- This ALB is used to access the NET6 Web API.
- You can use port 443 but I didn’t have an SSL certificate at hand.
- A public Application Load Balancer that listens on port 52323
- This one is used to interact with
dotnet-monitor - You could use a single ALB and set 2 listeners with 2 target groups, but in a realistic scenario you don’t want to open a port on your internet facing ALB, instead you’ll create a secondary internal ALB and use it to interact with the
dotnet-monitorAPI.
- This one is used to interact with
- An ECS Task Definition with 2 containers: the WebAPI container and the
dotnet-monitorcontainer. Thedotnet-monitorwill be deployed as a sidecar container that collects diagnostic information from the other container running .NET.
To deploy this stack I’ll be using AWS CDK.
The next code snippet is probably the most interesting part of the CDK app, and shows how to setup properly the dotmnet-monitor container and the app container in the ECS Task Definition.
  private FargateTaskDefinition CreateTaskDefinition()
        {
            var task = new FargateTaskDefinition(this,
                "task-definition-ecs-profiling-dotnet-demo",
                new FargateTaskDefinitionProps
                {
                    Cpu = 1024,
                    Family = "task-definition-ecs-profiling-dotnet-demo",
                    MemoryLimitMiB = 2048
                });

            task.AddVolume(new Amazon.CDK.AWS.ECS.Volume
            {
                Name = "diagnostics"
            });

            task.AddVolume(new Amazon.CDK.AWS.ECS.Volume
            {
                Name = "dumps"
            });

            var linuxParams = new LinuxParameters(this, "sys-ptrace-linux-params");
            linuxParams.AddCapabilities(Capability.SYS_PTRACE);

            task.AddContainer("container-app",
                new ContainerDefinitionOptions
                {
                    Cpu = 512,
                    MemoryLimitMiB = 1024,
                    Image = ContainerImage.FromAsset("../src/Profiling.Api"),
                    LinuxParameters = linuxParams,
                    Environment = new Dictionary<string, string>
                    {
                        {"DOTNET_DiagnosticPorts","/diag/port,nosuspend,connect"}
                    },
                    Logging = LogDriver.AwsLogs(new AwsLogDriverProps
                    {
                        StreamPrefix = "ecs"
                    }),
                    PortMappings = new IPortMapping[]
                    {
                        new PortMapping
                        {
                            ContainerPort = 80
                        }
                    }
                }).AddMountPoints(new MountPoint
            {
                ContainerPath = "/diag",
                SourceVolume = "diagnostics"
            }, new MountPoint
            {
                ContainerPath = "/dumps",
                SourceVolume = "dumps",
                ReadOnly = false
            });

            task.AddContainer("dotnet-monitor",
                new ContainerDefinitionOptions
                {
                    Cpu = 256,
                    MemoryLimitMiB = 512,
                    Image = ContainerImage.FromRegistry("mcr.microsoft.com/dotnet/monitor:6"),
                    Environment = new Dictionary<string, string>
                    {
                        { "DOTNETMONITOR_DiagnosticPort__ConnectionMode", "Listen" },
                        { "DOTNETMONITOR_DiagnosticPort__EndpointName", "/diag/port" },
                        { "DOTNETMONITOR_Urls", "http://+:52323" },
                        { "DOTNETMONITOR_Storage__DumpTempFolder", "/dumps"}
                    },
                    Command = new[] { "--no-auth" },
                    PortMappings = new IPortMapping[]
                    {
                        new PortMapping
                        {
                            ContainerPort = 52323
                        }
                    }

                }).AddMountPoints(new MountPoint
            {
                ContainerPath = "/diag",
                SourceVolume = "diagnostics"
            }, new MountPoint
            {
                ContainerPath = "/dumps",
                SourceVolume = "dumps",
                ReadOnly = false
            });

            return task;
        }
-
The
dotnet-monitortool is configured to run in Listen mode. The tool establishes a diagnostic communication channel at the specified Unix Domain Socket path by theDOTNETMONITOR_DiagnosticPort__EndpointNameenvironment variable.
Also the application container has aDOTNET_DiagnosticPortsenvironment variable specified so that the application’s runtime will communicate with the dotnet monitor instance at the specified Unix Domain Socket path.
Each port configuration specifies whether it is asuspendornosuspendport. Ports specifying suspend in their configuration will cause the runtime to pause early on in the startup path before most runtime subsystems have started. This allows any agent to receive a connection and properly setup before the application startup continues. -
In Listen mode the Unix Domain Socket file needs to be shared among the
dotnet-monitorcontainer and the app container you wish to monitor. If your diagnostic port is established at/diag/port, then a shared volume needs to be mounted at/diagin thedotnet-monitorcontainer and also in the app container. To share a directory in Fargate we’ll use Bind Mounts. -
The
dotnet-monitortool is configured to instruct the application runtime to produce dump files at the path specified by theDOTNETMONITOR_Storage__DumpTempFolderenvironment variable. If you want to get a dump on Fargate you’ll need to enable theSYS_PTRACECapability on the application container. -
By default,
dotnet monitorrequires authentication. For the purposes of this demo, authentication has been disabled by using the--no-authcommand line switch. -
By default,
dotnet monitorhas HTTPS enabled. For the purposes of this example, the artifact URLs have been changed tohttp://+:52323using theDOTNETMONITOR_Urlsenvironment variable such that a TLS certificate is not required.
If you want to take a look at the entire CDK app, you can go to my Github page.
After deploying the CDK app into AWS, we can test that the dotnet-monitor API is up and running with a simple cURL command:
$ curl http://alb-mon-ecs-prf-dotnet-demo-744303317.eu-west-1.elb.amazonaws.com:52323/info
{"version":"6.1.0+48853dad0d5d1efd50a90904505f68a137c7b789","runtimeVersion":"6.0.3","diagnosticPortMode":"Listen","diagnosticPortName":"/diag/port"}
Profiling the Demo API using dotnet-monitor
In my previous post I wrote a detailed guide about how to run a performance investigation in each one of the 3 endpoints of the demo API.
In this post I’m not going to show you how to find all the performance issues the demo API has.
I’m going to walk you through only 1 of the issues, that’s because the process to investigate and pinpoint what is going on with this app is practically identical as the one I did on my previous post.
In fact the only thing that changes is that I’m interacting with the dotnet-monitor HTTP API to collect diagnostics instead of the .NET CLI diagnostic tools.
Profiling the /blocking-threads endpoint
1. Using the /trace endpoint from dotnet-monitor to investigate possible performance issues
Observing the performance counters is always the first step when we want to begin a performance investigation.
To obtain the performance counters in a given interval we’re going invoke the dotnet-monitor /trace endpoint.
This endpoint captures a diagnostic trace of a process based on a predefined set of trace profiles. The format to invoke it is the following one:
GET /trace?pid={pid}&profile={profile}&durationSeconds={durationSeconds}&egressProvider={egressProvider}
pid: The ID of the process.profile: The name of the profile(s) used to collect events. Multiple profiles may be specified by separating them with commas. Default isCpu,Http,Metrics.**durationSeconds: The duration of the trace operation in seconds. Default is 30.egressProvider: If specified, uses the named egress provider for egressing the collected trace. When not specified, the trace is written to the HTTP response stream.
**The available profiles are:
Cpu: Tracks CPU usage and general .NET runtime information.Http: Tracks ASP.NET request handling and HttpClient requests.Logs: Tracks log events emitted at the Debug log level or higher.Metrics: Tracks event counters from the System.Runtime, Microsoft.AspNetCore.Hosting, and Grpc.AspNetCore.Server event sources.
If we invoke the /trace endpoint, we will receive a .nettrace file back. If we open it with Visual Studio, it will look like this:
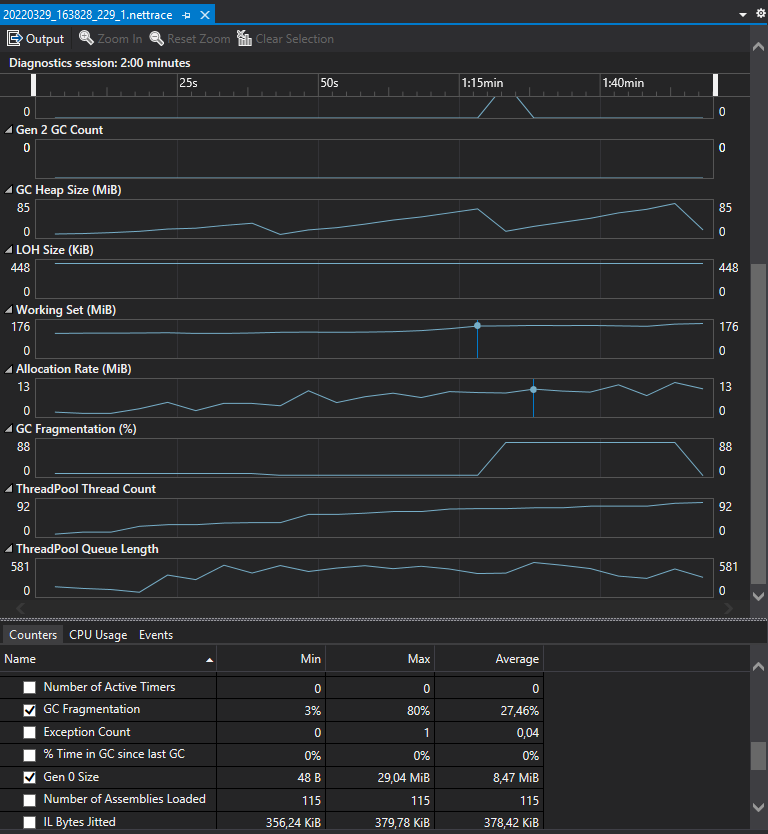
As you can see the contents of the .nettrace file are exactly the same as the output of the dotnet-counters tool. The main difference is that with dotnet-counters we can watch the application performance counters in real-time, meanwhile with dotnet-monitor we need to sample the counters during a period of time before being able to analyze them.
Right now there is no traffic in our application, so nothing worth mentioning is happening. Let’s start by applying some load.
To generate some load on the app I’ll be using Bombardier.
Bombardier is a modern HTTP(S) benchmarking tool, written in Golang and really simple to use when you want to run a performance or a load test.
I’m going to apply a load of 100 requests per second during 120 seconds to the blocking-threads endpoint.
bombardier -c 120 --rate 100 -l -d 120s http://alb-pub-ecs-prf-dotnet-demo-100430270.eu-west-1.elb.amazonaws.com/blocking-threads
And at the same time I’m going to capture a trace using the dotnet-monitor /trace endpoint.
GET http://alb-mon-ecs-prf-dotnet-demo-744303317.eu-west-1.elb.amazonaws.com:52323/trace?pid=1&durationSeconds=120
The following screenshots shows the values of the performance counters during the load test:
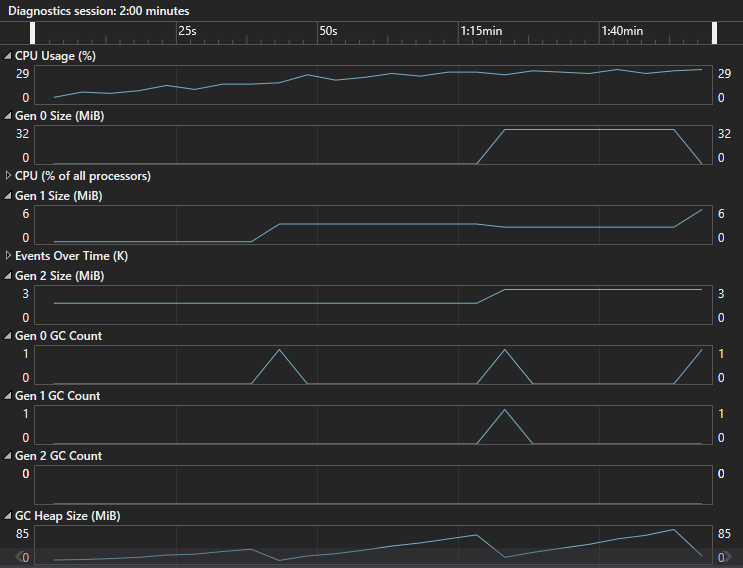
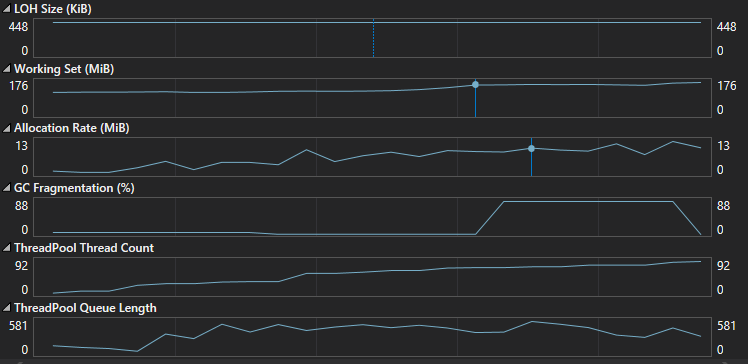
The counters that seemed OK were:
- The CPU usage was low.
- Very few GC collections and no Gen 2 GC Collection.
- LOH had a low and steady size.
The counters that seemed OFF were:
- The “ThreadPool Thread Count” counter was increasing exponentially during the test duration.
The “ThreadPool Thread Count” should not be growing like this, in an ideal application everything runs asynchronously which means that a low number of threads can serve a huge amount of requests.
In an async world when an incoming request arrives it gets a new thread from the Threadpool, that thread runs it’s current operation and when an async method is awaited, saves the current context and adds itself to the pool as an available thread.
When the async call completes or if a new request comes in at this point, the Threadpool checks if all the threads are already in operation, if yes it spawns up a new thread, if not it takes up one of the available threads from the pool.
The fact that the “ThreadPool Thread Count” counter keeps growing means that the application is expanding the Threadpool to handle incoming requests, which means that probably some threads are being blocked somewhere.
The blockage could be on purpose and maybe the app is doing some long running task, but maybe the threads are being blocked because there is something wrong, so it’s worth investigating further.
2. Using the /dump endpoint from dotnet-monitor and Visual Studio to analyze possible blocked threads
The dotnet monitor /dump endpoint captures a managed dump of a specified process without using a debugger.
The format to invoke it is the following one:
GET /dump?pid={pid}&type={type}&egressProvider={egressProvider}
pid: The ID of the process.type: The type of dump to capture. Default value isWithHeap.**egressProvider: If specified, uses the named egress provider for egressing the collected trace. When not specified, the trace is written to the HTTP response stream.
**The dump types are the following ones:
Mini: A small dump containing module lists, thread lists, exception information, and all stacks.Full: The largest dump containing all memory including the module images.Triage: A small dump containing only stacks for each thread.WithHeap: A large and relatively comprehensive dump containing module lists, thread lists, all stacks, exception information, handle information, and all memory except for mapped images.
I’m going to apply another load of 100 requests per second during 120 seconds to the blocking-threads endpoint with bombardier, and while the load test is running I’ll capture a dump invoking the /dump endpoint:
GET http://alb-mon-ecs-prf-dotnet-demo-744303317.eu-west-1.elb.amazonaws.com:52323/dump?pid=1&type=Full
After invoking the endpoint we will receive a dump file ( beware the file might be several Gigabytes in size, if you don’t want to receive such a huge file via HTTP you can configure dotnet-monitor to use an egressProvider).
Now we can open it with Visual Studio. To start a debugging session, select “Debug with Managed Only”.
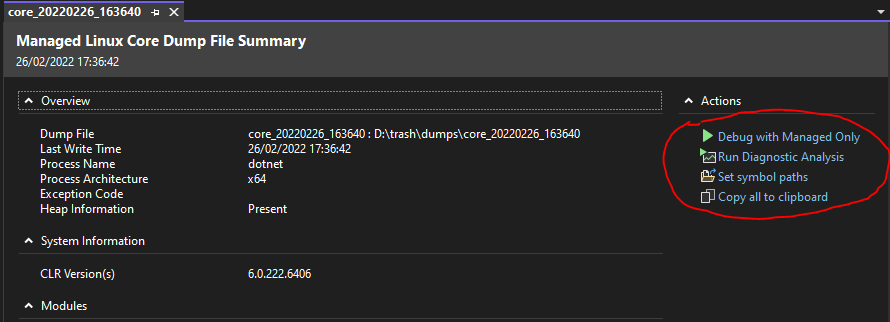
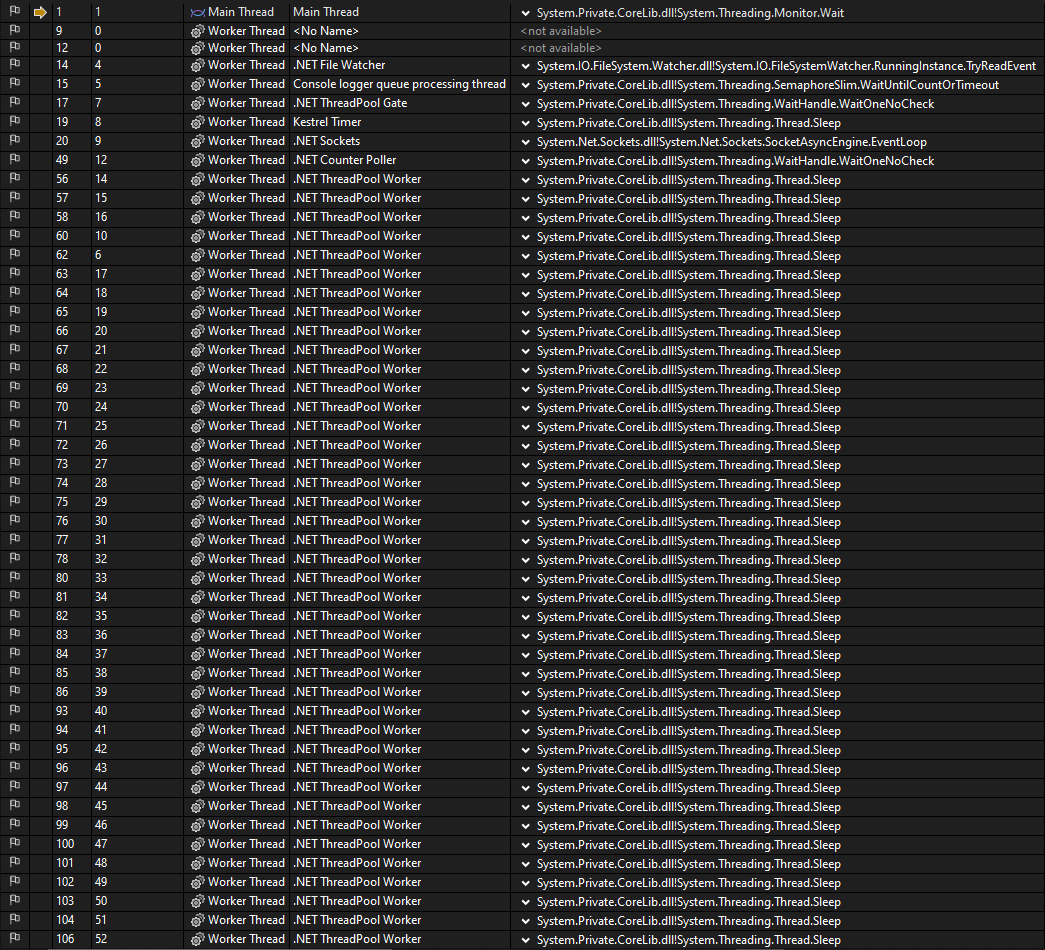
Keep in mind that a dump it’s a snapshot of your application in a concrete point in time, so you can’t debug the application, but what we can do is select “Debug > Windows > Threads” to get a list of what were the threads doing at the time we captured the dump.
And as you can see on the next screenshot, it looks suspicious the amount of threads that are on the “Sleep” state.
Another thing we can do is select “Debug > Windows > Parallel Stacks” and it gives us a more graphical view of what’s happening with the active threads.
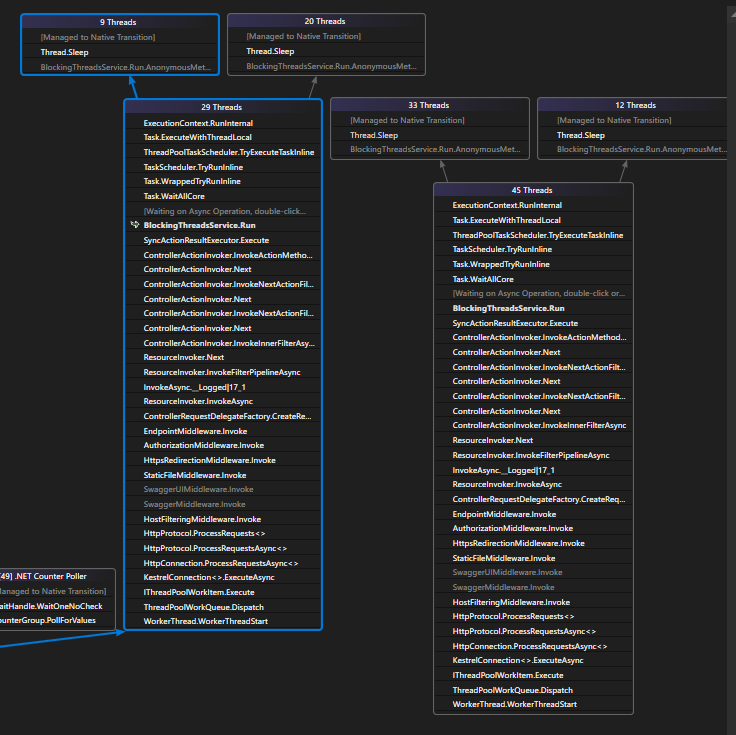
In this case we can see that there are 74 threads grouped on 2 stacks, if we take a deeper look at those stacks we recognize that “BlockingThreadsService.Run” is a function of our app, if we double click on it, Visual Studio will take us there.
To navigate from the Parallel Stacks window to the source code we need to enable the microsoft symbols server and also have access to the application symbols.
After double-clicking on the “BlockingThreadsService.Run” on the Parallel Stacks windows, Visual Studio will show us which command was this thread executing when the dump was created.
And it seems that the thread was stopped in the “Task.WaitAll” command.
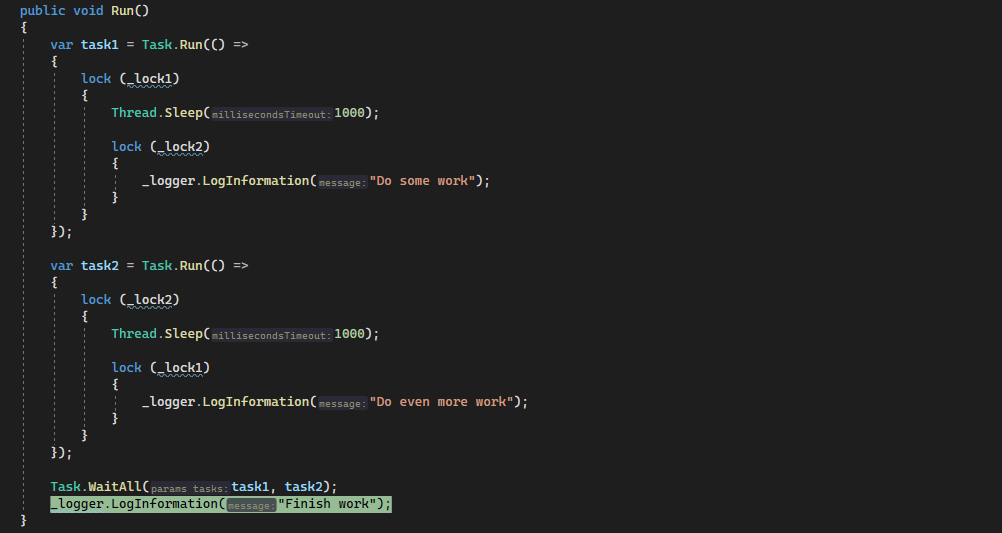
If we keep diggingg a little bit further and take a look at this thread call stack, we will see that Task1 is blocked on the lock statement
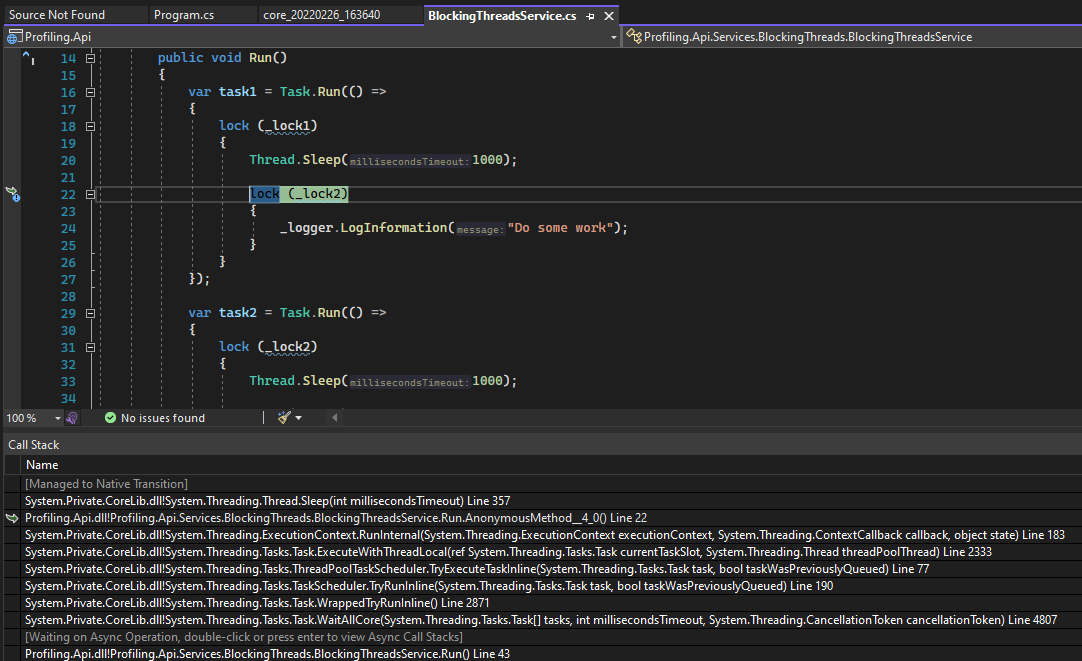
It’s pretty clear that there is some bad code on the “BlockingThreadsService.Run” function that is blocking threads, so now we can try to fix it.
I’m not going to fix it in this post, we have found the performance issue and now we can move on.
.NET CLI Diagnostic tools vs dotnet-monitor
As I stated in the previous section, it doesn’t matter if you’re using the .NET CLI diagnostic tools or dotnet-monitor to profile an app, the process to investigate and pinpoint what is going wrong is almost the same.
When using the .NET CLI diagnostic tools:
- Launch
dotnet-counters. - Apply some load to the application.
- Monitor the counters looking for something that doesn’t seems right. And after seeing which counter looks awry, use one of the other tools to drill further down:
- Use
dotnet-dumpif you want to collect information about the running threads with their corresponding stack traces or information about possible exceptions that might have occurred. - Use
dotnet-traceif you want to collect a CPU trace. - Use
dotnet-gcdumpif you want to collect a GC dump.
- Use
When using the dotnet-monitor tool:
- Apply some load to the application.
- Invoke the
/traceendpoint from thedotnet-monitorto obtain a diagnostic trace that spans the entire load test duration. - Open the
.nettracefile with Visual Studio. - Inspect the performance counters looking for something that doesn’t seems right. And after seeing which counter looks awry, use one of the other endpoints to drill further down:
- Invoke the
/dumpendpoint if you want to collect information about the running threads with their corresponding stack traces or information about possible exceptions that might have occurred. - Invoke the
/traceendpoint withprofile=Cpuif you want to collect a CPU trace. - Invoke the
/gcdumpendpoint if you want to collect a GC dump.
- Invoke the