Profiling a .NET6 app running in a linux container with dotnet-trace, dotnet-dump, dotnet-counters, dotnet-gcdump and Visual Studio
Introduction
Every software developer at some time or other has stumbled with an application that doesn’t perform well, and when it happens I find a lot of unfamiliarity about what steps to take. And that’s the reason I decided to write this post.
This post is aimed at people with no knowledge of how to profile an application using the .NET CLI tools and what should they look for when a possible performance issue arises. If you’re a performance veteran you can skip it.
I have built a containerized .NET6 application beforehand, this app has a few performance issues and we’re going to try to spot them.
The performance issues on this demo app are oversimplified and I’m sure that if you take a quick glance on its source code you’ll be able to spot them pretty quickly, but we are not going to do that, instead of that we’re going to use the .NET CLI diagnostic tools to profile the app and try to understand what is happening.
On a real scenario the performance issues will not be so easy to spot on, but the objective of this post is to serve as stepping stone for beginners, so when faced with a real performance issue you know the basic steps to follow.
.NET CLI diagnostic tools
A couple years ago Microsoft introduced a series of new diagnostic tools:
dotnet-countersto view Performance Counters.dotnet-dumpto capture and analyze Windows and Linux dumps.dotnet-traceto capture runtime events, GC collections and sample CPU stacks.dotnet-gcdumpto collect GC dumps.
Those tools are cross-platform and nowadays are the preferred method of collecting diagnostic information for .NET Core scenarios targeting .NET Core 3.0 or above.
Adding .NET CLI tools in a container
The .NET Core global CLI diagnostic tools (dotnet-counters, dotnet-dump, dotnet-gcdump and dotnet-trace) are designed to work in a wide variety of environments and should all work directly in Docker containers.
The only complicating factor of using these tools in a container is that they are installed with the .NET SDK and many Docker containers run without the .NET SDK present.
One easy solution to this problem is to install the tools in the initial Docker image. The tools don’t need the .NET SDK to run, only to be installed. Therefore, it’s possible to create a Dockerfile with a multi-stage build that installs the tools in a build stage (where the .NET SDK is present) and then copies the binaries into the final image.
The only downside to this approach is increased Docker image size.
The next code snippet shows how to add the .NET CLI diagnostic tools inside a docker image alongside your application.
FROM mcr.microsoft.com/dotnet/sdk:6.0-bullseye-slim AS build-env
WORKDIR /app

# Copy csproj and restore dependencies
COPY Profiling.Api.csproj ./src/
RUN dotnet restore "./src/Profiling.Api.csproj"

# Copy everything, build and publish
COPY . ./src/
RUN dotnet publish src/*.csproj -c Release -o /app/publish

# Install dotnet debug tools
RUN dotnet tool install --tool-path /tools dotnet-trace \
 && dotnet tool install --tool-path /tools dotnet-counters \
 && dotnet tool install --tool-path /tools dotnet-dump \
 && dotnet tool install --tool-path /tools dotnet-gcdump

# Build runtime imagedock
FROM mcr.microsoft.com/dotnet/aspnet:6.0-bullseye-slim

# Copy dotnet-tools
WORKDIR /tools
COPY --from=build-env /tools .

# Copy app
WORKDIR /app
COPY --from=build-env /app/publish .

# Set entrypoint
ENTRYPOINT ["dotnet", "Profiling.Api.dll"]
Executing .NET CLI tools in a running container
In order to access these tools on a running container, we need to be able to access it. We can use the docker exec command to launch a shell on running container.
docker exec -it -w //tools <container-id> sh
And once we’re inside the container we’re ready to launch any of the diagnostic tools like this:
./dotnet-counters monitor --process-id 1
Demo Application
The application we’re going to profile is a .NET 6 API with 3 endpoints:
/blocking-threadsendpoint./high-cpuendpoint./memory-leakendpoint.
As you can see, the performance issues we will try to solve on each endpoint are pretty self-explanatory.
The source code can be found on my GitHub
I’ll be running the app as a docker container on my local machine because it’s the easiest and fastest setup possible, but it doesn’t matter if you’re running on a Kubernetes cluster, a virtual machine or any other cloud services, the steps you need to follow when trying to pinpoint a performance issue are exactly the same.
The only thing that might change are the steps needed to install the diagnostic tools binaries.
To simulate a more realistic environment I have set some memory an CPU limits to the app running on docker (1024Mb and 1 CPU).
docker run -d -p 5003:80 -m 1024m --cpus=1 profiling.api
Also I’ll be using Bombardier to generate traffic on the app.
Bombardier is a modern HTTP(S) benchmarking tool, written in Golang and really simple to use when you want to run a performance or a load test.
Profiling the /blocking-threads endpoint
1. Using dotnet-counters to investigate possible performance issues
dotnet-counters is always the first step when we want to begin a performance investigation.
dotnet-counters is a performance monitoring and first-level performance investigation tool. It can observe performance counter values that are published via the EventCounter API.
For example, you can quickly monitor things like the CPU usage or the rate of exceptions being thrown in your .NET Core application to see if there’s anything suspicious before diving into more serious performance investigation tools like dotnet-dump or dotnet-trace.
The command we’re going to use to launch dotnet-counters is the following one:
./dotnet-counters monitor --process-id 1 --refresh-interval 3 --counters System.Runtime,Microsoft.AspNetCore.Hosting
- The
monitorcommand starts monitoring a .NET application. - The
-p|--process-idparameter specifies the ID of the process we want to monitor, in this case we’re inside a docker container so the PID is always 1.
If you’re running outside a container and do not know the PID of the process you want to monitor, you can run the./dotnet-counters pscommand. - The
--refresh-intervalis the number of seconds between the counter polling values. - The
--countersis an optional parameter and you need to specify a comma-separated list of counters.
The default counters are theSystem.Runtimecounters, but when working with an API I find useful to monitor also theMicrosoft.AspNetCore.Hostingcounters, so you can see how many requests are being served, how many requests are failing, request rate, etc.
That’s the output you’ll see after launching the tool:
[Microsoft.AspNetCore.Hosting]
    Current Requests                                               0
    Failed Requests                                                0
    Request Rate (Count / 1 sec)                                   0
    Total Requests                                                 0
[System.Runtime]
    % Time in GC since last GC (%)                                 0
    Allocation Rate (B / 1 sec)                                8,168
    CPU Usage (%)                                                  0
    Exception Count (Count / 1 sec)                                0
    GC Committed Bytes (MB)                                        0
    GC Fragmentation (%)                                           0
    GC Heap Size (MB)                                              3
    Gen 0 GC Count (Count / 1 sec)                                 0
    Gen 0 Size (B)                                                 0
    Gen 1 GC Count (Count / 1 sec)                                 0
    Gen 1 Size (B)                                                 0
    Gen 2 GC Count (Count / 1 sec)                                 0
    Gen 2 Size (B)                                                 0
    IL Bytes Jitted (B)                                       68,801
    LOH Size (B)                                                   0
    Monitor Lock Contention Count (Count / 1 sec)                  0
    Number of Active Timers                                        0
    Number of Assemblies Loaded                                  110
    Number of Methods Jitted                                     620
    POH (Pinned Object Heap) Size (B)                              0
    ThreadPool Completed Work Item Count (Count / 1 sec)           0
    ThreadPool Queue Length                                        0
    ThreadPool Thread Count                                        0
    Time spent in JIT (ms / 1 sec)                                 0
    Working Set (MB)                                              61
As you can see, it’s quite a lot of counters, let me explain briefly the meaning of each one of them.
- Current Requests: The total number of requests that have started, but not yet stopped.
- Failed Requests: The total number of failed requests that have occurred for the life of the app.
- Request Rate: The number of requests that occur per update interval.
- Total Requests: The total number of requests that have occurred for the life of the app.
- % Time in GC since last GC (%): The percent of time in GC since the last GC.
- Allocation Rate: Number of bytes allocated in the managed heap between update intervals.
- CPU Usage: The percentage of CPU usage relative to to CPU resource allocated.
- Exception Count: The number of exceptions that have occurred.
- GC Commited Bytes: The number of bytes committed by the GC.
- GC Fragmentation: The GC Heap Fragmentation (available on .NET 5 and later versions).
- GC Heap Size: The number of bytes allocated by the GC.
- Gen 0 GC Count: The number of times GC has occurred for Gen 0 per update interval.
- Gen 0 Size: The number of bytes for Gen 0 GC.
- Gen 1 GC Count: The number of times GC has occurred for Gen 1 per update interval.
- Gen 1 Size: The number of bytes for Gen 1 GC.
- Gen 2 GC Count: The number of times GC has occurred for Gen 2 per update interval.
- Gen 2 Size: The number of bytes for Gen 2 GC.
- IL Bytes Jitted: The total size of ILs that are JIT-compiled, in bytes.
- LOH Size: The number of bytes for the Large Object Heap.
- Monitor Lock Contention Count: The number of times there was contention when trying to take the monitor’s lock.
- Number of Active Timers: The number of Timer instances that are currently active.
- Number of Assemblies Loaded: The number of Assembly instances loaded into a process at a point in time.
- Number of Methods Jitted: The number of methods that are JIT-compiled.
- POH (Pinned Object Heap) Size: The number of bytes for the pinned object heap (available on .NET 5 and later versions).
- ThreadPool Completed Work Item Count: The number of work items that have been processed so far in the ThreadPool.
- ThreadPool Queue Length: The number of work items that are currently queued to be processed in the ThreadPool.
- ThreadPool Thread Count: The number of thread pool threads that currently exist in the ThreadPool.
- Time spent in JIT: The total time spent doing jitting work.
- Working Set: The amount of physical memory mapped to the process.
Right now we’re monitoring the app counters in real time, but there is no traffic in our application, so nothing worth mentioning is happening. Let’s apply some load using bombardier.
I’m going to apply a load of 100 requests per second during 120 seconds to the blocking-threads endpoint.
./bombardier.exe -c 120 --rate 100 -l -d 120s http://localhost:5003/blocking-threads
These are the values of the counters halfway through the load test:
[Microsoft.AspNetCore.Hosting]
    Current Requests                                              47
    Failed Requests                                                0
    Request Rate (Count / 1 sec)                                  12
    Total Requests                                               615
[System.Runtime]
    % Time in GC since last GC (%)                                 0
    Allocation Rate (B / 1 sec)                              437,504
    CPU Usage (%)                                                 13
    Exception Count (Count / 1 sec)                                0
    GC Committed Bytes (MB)                                       15
    GC Fragmentation (%)                                           5.626
    GC Heap Size (MB)                                             12
    Gen 0 GC Count (Count / 1 sec)                                 0
    Gen 0 Size (B)                                                24
    Gen 1 GC Count (Count / 1 sec)                                 0
    Gen 1 Size (B)                                         7,551,272
    Gen 2 GC Count (Count / 1 sec)                                 0
    Gen 2 Size (B)                                         1,681,048
    IL Bytes Jitted (B)                                      267,867
    LOH Size (B)                                              98,408
    Monitor Lock Contention Count (Count / 1 sec)                  1
    Number of Active Timers                                        0
    Number of Assemblies Loaded                                  113
    Number of Methods Jitted                                   2,889
    POH (Pinned Object Heap) Size (B)                      2,659,768
    ThreadPool Completed Work Item Count (Count / 1 sec)          51
    ThreadPool Queue Length                                      207
    ThreadPool Thread Count                                       47
    Time spent in JIT (ms / 1 sec)                                 0
    Working Set (MB)                                              82
And these are the values of the counters at the end of the load test:
[Microsoft.AspNetCore.Hosting]
    Current Requests                                              65
    Failed Requests                                                0
    Request Rate (Count / 1 sec)                                  35
    Total Requests                                             3,103
[System.Runtime]
    % Time in GC since last GC (%)                                 0
    Allocation Rate (B / 1 sec)                            1,270,560
    CPU Usage (%)                                                 20
    Exception Count (Count / 1 sec)                                0
    GC Committed Bytes (MB)                                       25
    GC Fragmentation (%)                                          14.214
    GC Heap Size (MB)                                             21
    Gen 0 GC Count (Count / 1 sec)                                 0
    Gen 0 Size (B)                                                24
    Gen 1 GC Count (Count / 1 sec)                                 0
    Gen 1 Size (B)                                         6,581,168
    Gen 2 GC Count (Count / 1 sec)                                 0
    Gen 2 Size (B)                                         8,775,656
    IL Bytes Jitted (B)                                      272,942
    LOH Size (B)                                              98,408
    Monitor Lock Contention Count (Count / 1 sec)                  1
    Number of Active Timers                                        0
    Number of Assemblies Loaded                                  113
    Number of Methods Jitted                                   2,973
    POH (Pinned Object Heap) Size (B)                      4,559,088
    ThreadPool Completed Work Item Count (Count / 1 sec)         135
    ThreadPool Queue Length                                    1,361
    ThreadPool Thread Count                                       65
    Time spent in JIT (ms / 1 sec)                                 0
    Working Set (MB)                                              91
The counters that seemed OK were:
- The CPU usage was low.
- Allocation rate was low.
- No GC collections.
- LOH had a low and steady size.
The counters that seemed OFF were:
- Poor Request/Rate ratio.
- The “ThreadPool Queue Length” and “ThreadPool Thread Count” counters were increasing exponentially during the test duration.
The “ThreadPool Thread Count” should not be growing like this, in an ideal application everything runs asynchronously which means that a low number of threads can serve a huge amount of requests.
In an async world when an incoming request arrives it gets a new thread from the Threadpool, that thread runs it’s current operation and when an async method is awaited, saves the current context and adds itself to the pool as an available thread.
When the async call completes or if a new request comes in at this point, the Threadpool checks if all the threads are already in operation, if yes it spawns up a new thread, if not it takes up one of the available threads from the pool.
The fact that the “ThreadPool Thread Count” counter keeps growing means that the application is expanding the Threadpool to handle incoming requests, which means that probably some threads are being blocked somewhere.
The blockage could be on purpose and maybe the app is doing some long running task, but maybe the threads are being blocked because there is something wrong, so it’s worth investigating further.
2. Using dotnet-dump and Visual Studio to analyze possible blocked threads
The dotnet-dump diagnostic tool is the one to use when you want to take a look at what are the threads doing.
dotnet-dump is capable to collect and analyze Windows and Linux dumps without any native debugger involved, by default dotnet-dump creates a full dump which contains a snapshot of the memory, information about the running threads with their corresponding stack traces and information about possible exceptions that might have occurred.
I’m going to apply another load of 100 requests per second during 120 seconds to the blocking-threads endpoint with bombardier, and while the load test is running I’ll capture a dump using:
./dotnet-dump collect --process-id 1
- The
collectcommand collects a dump from a running process. - The
-p|--process-idparameter specifies the process id to collect the trace, in this case we’re inside a docker container so the PID is always 1.
A good way to analyze this dump is with Visual Studio, but the dump is inside the docker container, so I’m going to copy it from inside the container to my local machine using the command:
docker cp <container-id>:<path-to-the-dump> .
Now we can open it with Visual Studio. To start a debugging session, select “Debug with Managed Only”.
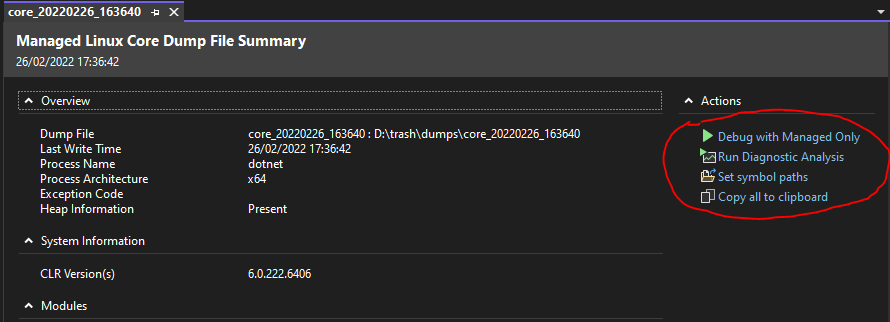
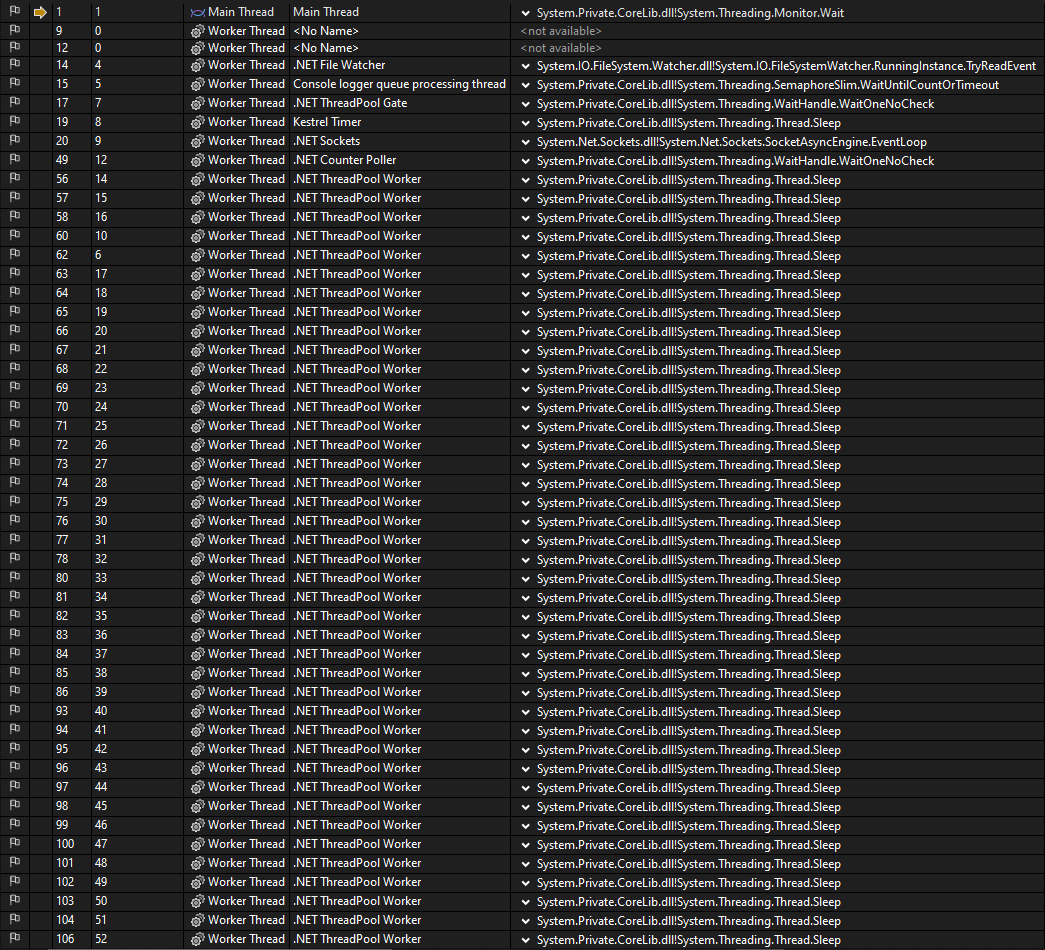
Keep in mind that a dump it’s a snapshot of your application in a concrete point in time, so you can’t debug the application, but what we can do is select “Debug > Windows > Threads” to get a list of what were the threads doing at the time we captured the dump.
And as you can see on the next screenshot, it looks suspicious the amount of threads that are on the “Sleep” state.
Another thing we can do is select “Debug > Windows > Parallel Stacks” and it gives us a more graphical view of what’s happening with the active threads.
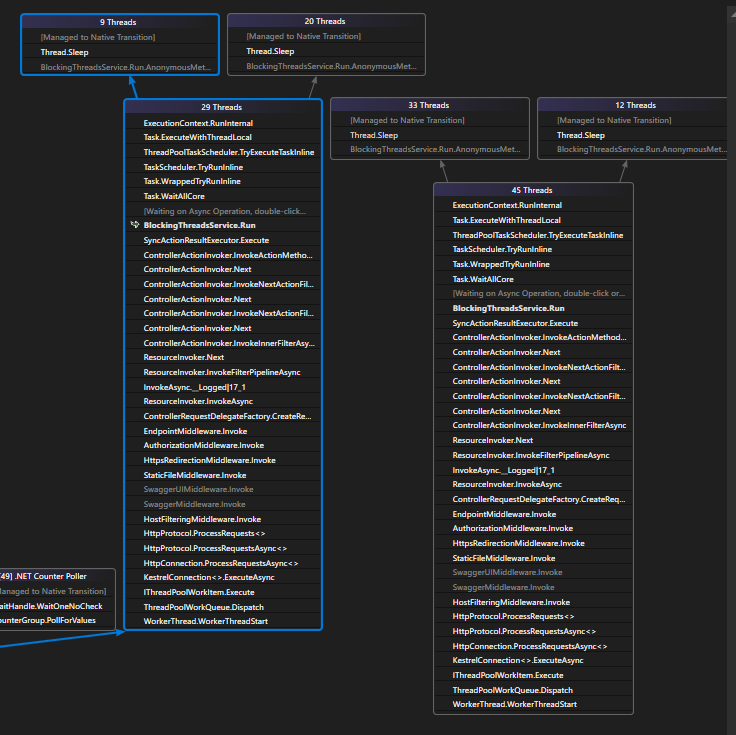
In this case we can see that there are 74 threads grouped on 2 stacks, if we take a deeper look at those stacks we recognize that “BlockingThreadsService.Run” is a function of our app, if we double click on it, Visual Studio will take us there.
To navigate from the Parallel Stacks window to the source code we need to enable the microsoft symbols server and also have access to the application symbols.
After double-clicking on the “BlockingThreadsService.Run” on the Parallel Stacks windows, Visual Studio will show us which command was this thread executing when the dump was created.
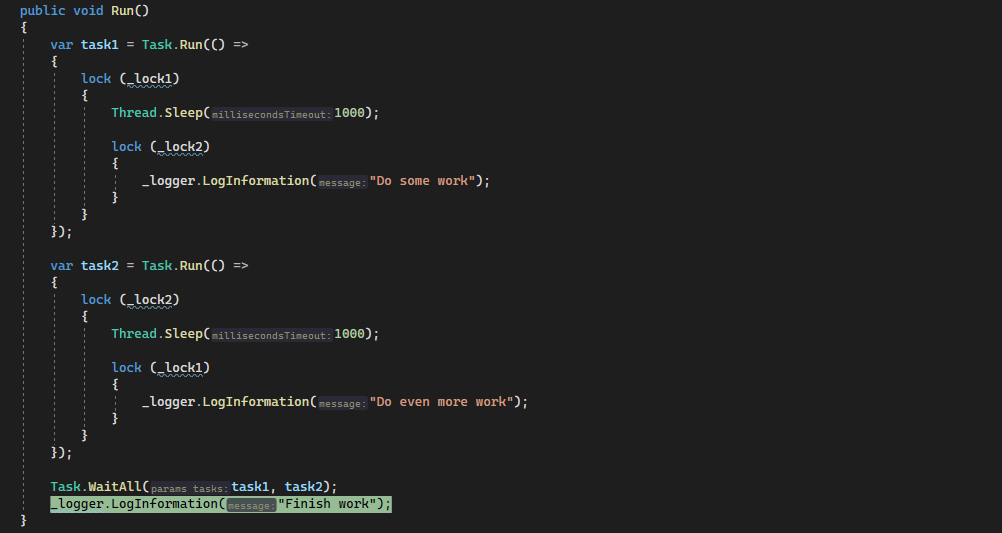
And it seems that the thread was stopped in the “Task.WaitAll” command.
If we keep diggingg a little bit further and take a look at this thread call stack, we will see that Task1 is blocked on the lock statement
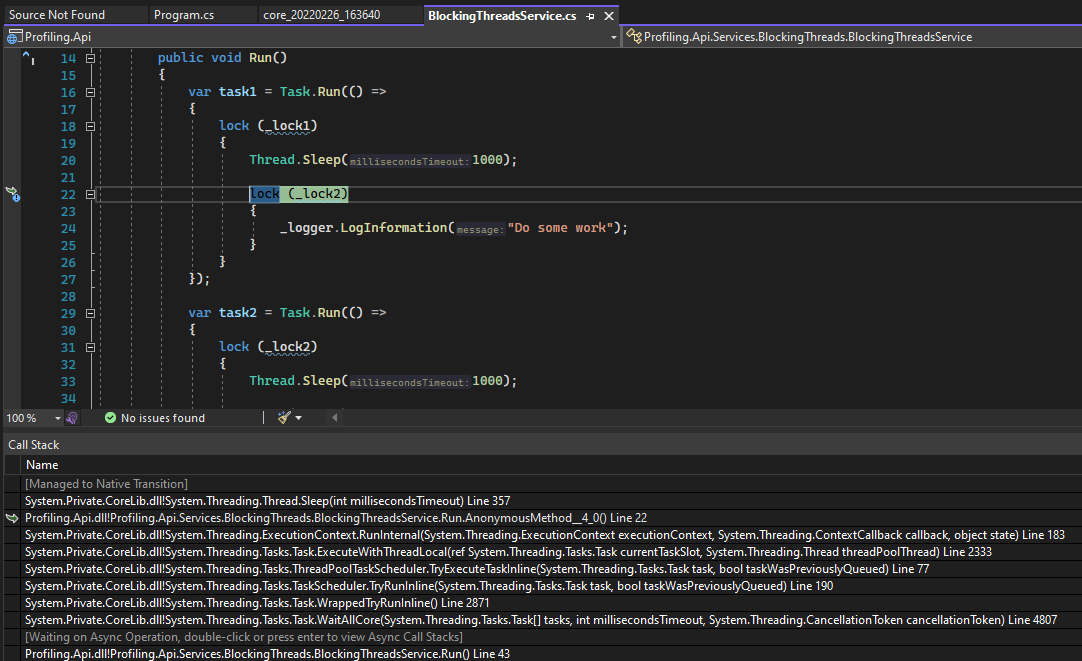
It’s pretty clear that there is some bad code on the “BlockingThreadsService.Run” function that is blocking threads, so now we can try to fix it.
I’m not going to fix it in this post, we have found the performance issue and now we can move on to another one.
Profiling the /high-cpu endpoint
1. Using dotnet-counters to investigate possible performance issues
We’re going to follow the same steps we did on the previous performance issue:
- Launch
dotnet-counters - Apply some load with
bombardierto the/high-cpuendpoint - Monitor the counters looking for something that doesn’t seems right.
These are the values of the counters halfway through the load test:
[Microsoft.AspNetCore.Hosting]
    Current Requests                                               4
    Failed Requests                                                0
    Request Rate (Count / 1 sec)                                   1
    Total Requests                                                71
[System.Runtime]
    % Time in GC since last GC (%)                                 0
    Allocation Rate (B / 1 sec)                               48,608
    CPU Usage (%)                                                 99
    Exception Count (Count / 1 sec)                                0
    GC Committed Bytes (MB)                                       10
    GC Fragmentation (%)                                           0.231
    GC Heap Size (MB)                                              6
    Gen 0 GC Count (Count / 1 sec)                                 0
    Gen 0 Size (B)                                                24
    Gen 1 GC Count (Count / 1 sec)                                 0
    Gen 1 Size (B)                                         1,535,312
    Gen 2 GC Count (Count / 1 sec)                                 0
    Gen 2 Size (B)                                         2,185,032
    IL Bytes Jitted (B)                                      247,267
    LOH Size (B)                                             196,792
    Monitor Lock Contention Count (Count / 1 sec)                  6
    Number of Active Timers                                        0
    Number of Assemblies Loaded                                  113
    Number of Methods Jitted                                   2,664
    POH (Pinned Object Heap) Size (B)                      2,206,568
    ThreadPool Completed Work Item Count (Count / 1 sec)           1
    ThreadPool Queue Length                                      695
    ThreadPool Thread Count                                        4
    Time spent in JIT (ms / 1 sec)                                 0
    Working Set (MB)                                              81
And these are the values of the counters at the end of the load test:
[Microsoft.AspNetCore.Hosting]
    Current Requests                                               3
    Failed Requests                                                0
    Request Rate (Count / 1 sec)                                   0
    Total Requests                                               136
[System.Runtime]
    % Time in GC since last GC (%)                                53
    Allocation Rate (B / 1 sec)                                8,128
    CPU Usage (%)                                                 99
    Exception Count (Count / 1 sec)                                0
    GC Committed Bytes (MB)                                       11
    GC Fragmentation (%)                                           3.386
    GC Heap Size (MB)                                             10
    Gen 0 GC Count (Count / 1 sec)                                 0
    Gen 0 Size (B)                                                24
    Gen 1 GC Count (Count / 1 sec)                                 0
    Gen 1 Size (B)                                           462,464
    Gen 2 GC Count (Count / 1 sec)                                 0
    Gen 2 Size (B)                                         5,019,752
    IL Bytes Jitted (B)                                      252,401
    LOH Size (B)                                             196,792
    Monitor Lock Contention Count (Count / 1 sec)                  0
    Number of Active Timers                                        0
    Number of Assemblies Loaded                                  113
    Number of Methods Jitted                                   2,728
    POH (Pinned Object Heap) Size (B)                      3,145,928
    ThreadPool Completed Work Item Count (Count / 1 sec)           0
    ThreadPool Queue Length                                    1,651
    ThreadPool Thread Count                                        3
    Time spent in JIT (ms / 1 sec)                                 0
    Working Set (MB)                                              83
The counters that seemed OK were:
- The threadpool thread count was relatively small.
- Allocation rate was low.
- No GC collections.
- LOH had a low and steady size.
The counters that seemed OFF were:
- A terrible Request/Rate ratio.
- The CPU Usage was almost 100% during the entire length of the load test.
Having this low request/rate tied to the fact that the CPU usage was almost 100% during the entire duration of the load test means that the CPU is the current bottleneck.
Having this high CPU usage and low request/rate might not be a performance issue, maybe this application is doing some heavy CPU operations on purpose, or maybe there are some operations that are wasting too many CPU cycles.
Let’s dig deeper.
2. Using dotnet-trace and Visual Studio to analyze a CPU trace
The dotnet-trace diagnostic tool collects diagnostic traces from a running process. It can collect either CPU traces or GC collections and object allocations traces. It also captures CLR events.
I’m going to apply another load of 100 requests per second during 120 seconds to the high-cpu endpoint with bombardier, and while the load test is running I’ll capture a CPU trace using the command:
./dotnet-trace collect --process-id 1 --duration 00:00:30
- The
collectcommand collects a diagnostic trace from a running process. - The
-p|--process-idparameter specifies the process id to collect the trace, in this case we’re inside a docker container so the PID is always 1. - The
--durationparameter when specified, will trace for the given timespan and then automatically stop the trace. - By default
dotnet-tracecollects CPU traces and CLR events, if you want to capture instead GC collection traces you can use the--profileparameter.
We’re going to analyze this trace with Visual Studio also, but the trace is inside the docker container, so I’m going to copy it from inside the container to my local machine using the command:
docker cp <container-id>:<path-to-the-trace> .
Now we can open the trace with Visual Studio, and right after opening it we are prompted with the top CPU functions.
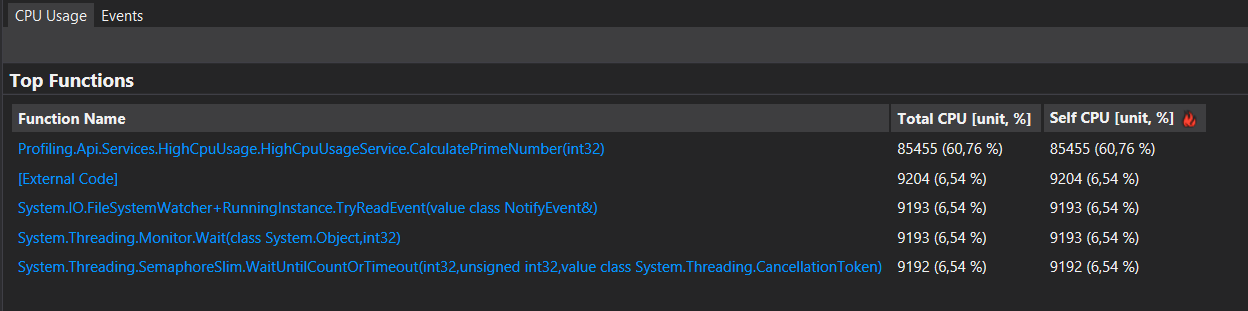
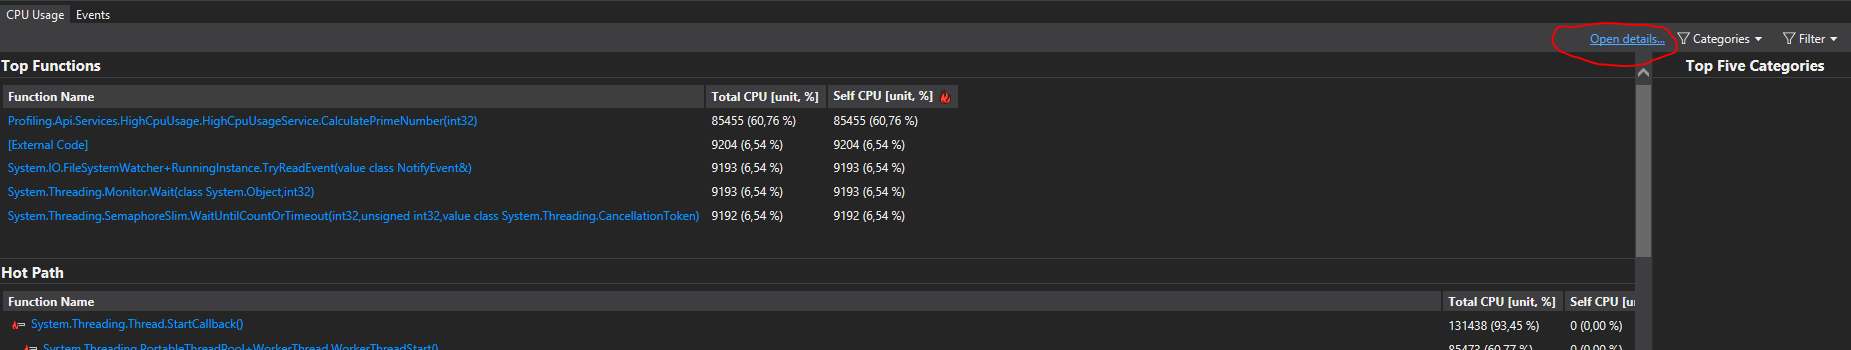
On this list we can see that “CalculatePrimeNumber” takes the number one spot on the list with more than 60% of CPU time. If we click on the “Open details” link we can get a more in-depth information.
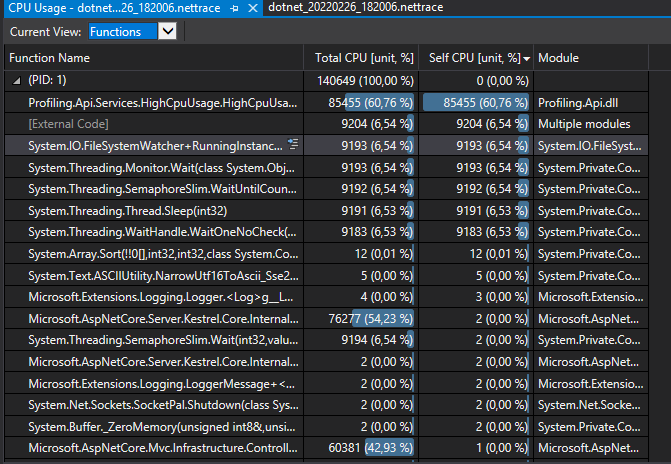
This next section lists every function that the .NET trace profiled and shows the total CPU time spent and the self CPU time spent.
- Total CPU time: CPU time spent executing code in this function and in functions called by this function.
- Self CPU time: CPU time spent executing code in this function, excluding time in functions called by this function.
One way to investigate is ordering by “Self CPU”, we’ll get the functions ordered by how much CPU time they spent without any dependency.
We can also view the call tree for every function, clicking in the “Show Hot Path” and “Expand Hot Path” will take us to the CPU hot path.
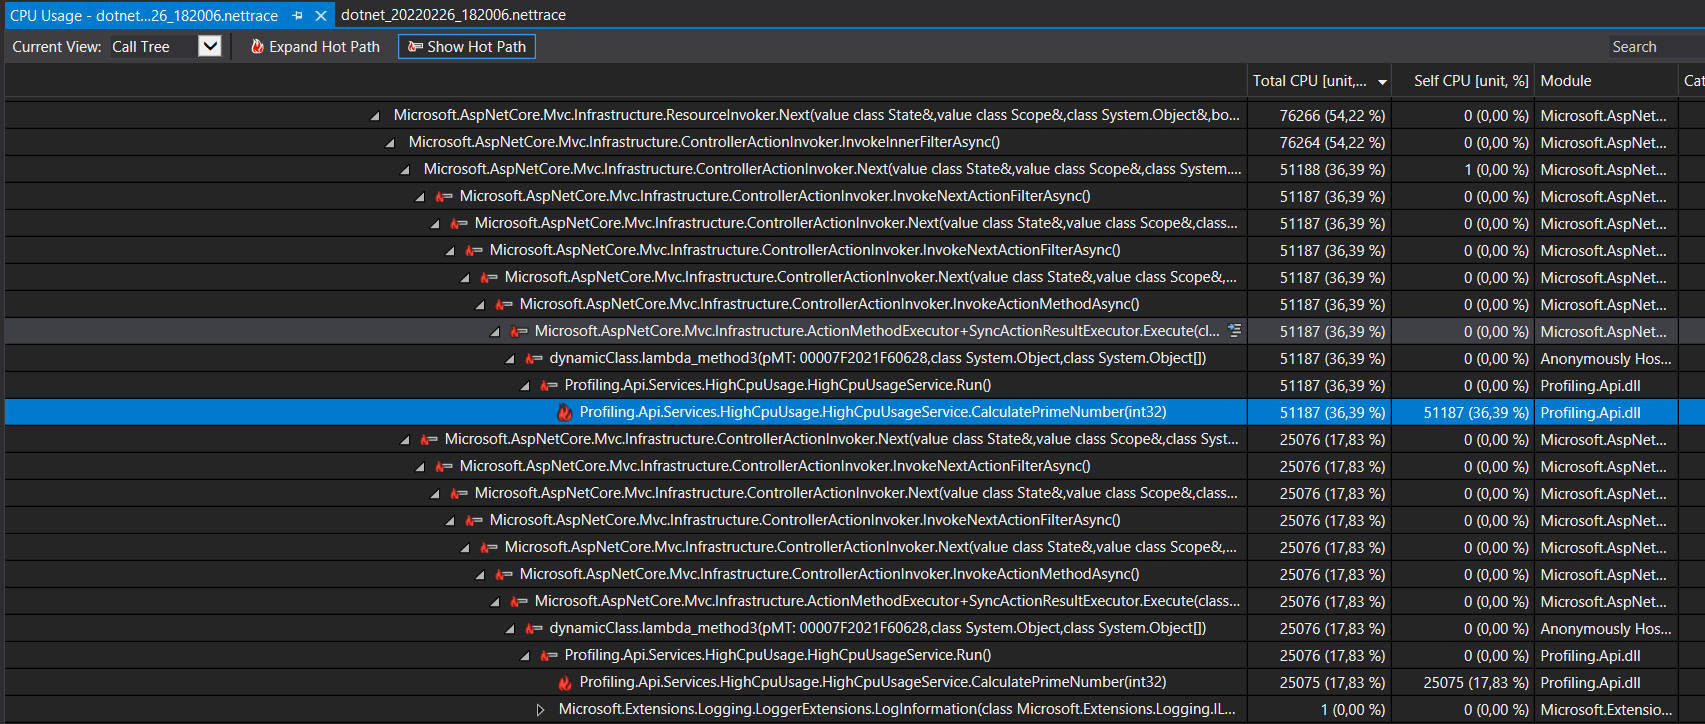
After taking a look at the trace, it’s pretty clear that the performance issue is the “CalculatePrimeNumber” function, and therefore we can go now and try to fix it.
The “CalculatePrimeNumber” function is spending a huge amount of CPU time, so now we can take a look at the source code and try to determine if the CPU spent by this method is legitimate, it is a bug or maybe the code can be improved to reduce the usage.
Profiling the /memory-leak endpoint
1. Using dotnet-counters to investigate possible issue
We’re going to follow the same steps we did on the previous performance issues:
- Launch
dotnet-counters. - Apply some load with
bombardierto the/memory-leakendpoint. - Monitor the counters looking for something that doesn’t seems right.
These are the values of the counters halfway through the load test:
[Microsoft.AspNetCore.Hosting]
    Current Requests                                               1
    Failed Requests                                                0
    Request Rate (Count / 1 sec)                                  45
    Total Requests                                             2,075
[System.Runtime]
    % Time in GC since last GC (%)                                 1
    Allocation Rate (B / 1 sec)                                1.113e+08
    CPU Usage (%)                                                101
    Exception Count (Count / 1 sec)                                0
    GC Committed Bytes (MB)                                      172
    GC Fragmentation (%)                                           4.763
    GC Heap Size (MB)                                            162
    Gen 0 GC Count (Count / 1 sec)                                22
    Gen 0 Size (B)                                           192,120
    Gen 1 GC Count (Count / 1 sec)                                 0
    Gen 1 Size (B)                                         3,996,216
    Gen 2 GC Count (Count / 1 sec)                                 0
    Gen 2 Size (B)                                            1.5739e+08
    IL Bytes Jitted (B)                                      272,014
    LOH Size (B)                                              98,408
    Monitor Lock Contention Count (Count / 1 sec)                 15
    Number of Active Timers                                        0
    Number of Assemblies Loaded                                  113
    Number of Methods Jitted                                   3,009
    POH (Pinned Object Heap) Size (B)                      4,876,328
    ThreadPool Completed Work Item Count (Count / 1 sec)          90
    ThreadPool Queue Length                                    2,079
    ThreadPool Thread Count                                        2
    Time spent in JIT (ms / 1 sec)                                 0
    Working Set (MB)                                             245
And these are the values of the counters at the end of the load test:
[Microsoft.AspNetCore.Hosting]
    Current Requests                                               1
    Failed Requests                                                0
    Request Rate (Count / 1 sec)                                  47
    Total Requests                                             6,534
[System.Runtime]
    % Time in GC since last GC (%)                                 1
    Allocation Rate (B / 1 sec)                               1.1626e+08
    CPU Usage (%)                                                 99
    Exception Count (Count / 1 sec)                                0
    GC Committed Bytes (MB)                                      500
    GC Fragmentation (%)                                           3.639
    GC Heap Size (MB)                                            478
    Gen 0 GC Count (Count / 1 sec)                                23
    Gen 0 Size (B)                                           176,048
    Gen 1 GC Count (Count / 1 sec)                                 0
    Gen 1 Size (B)                                         5,040,208
    Gen 2 GC Count (Count / 1 sec)                                 0
    Gen 2 Size (B)                                            4.8388e+08
    IL Bytes Jitted (B)                                      274,173
    LOH Size (B)                                             241,800
    Monitor Lock Contention Count (Count / 1 sec)                 26
    Number of Active Timers                                        0
    Number of Assemblies Loaded                                  113
    Number of Methods Jitted                                   3,019
    POH (Pinned Object Heap) Size (B)                      4,876,328
    ThreadPool Completed Work Item Count (Count / 1 sec)          94
    ThreadPool Queue Length                                      674
    ThreadPool Thread Count                                        2
    Time spent in JIT (ms / 1 sec)                                 0
    Working Set (MB)                                             575
The counters that seemed OK were:
- The threadpool thread count was small.
- CPU usage was high but there were a pretty decent number of total requests processed.
The counters that seemed OFF were:
- Allocation rate was quite high.
- The Working Set and the GC Heap Size kept growing exponentially and both had a similar size at the end of the test.
- The fact that the GC Heap Size kept growing during the test means that more and more managed objects we’re added to the memory.
- GC Gen 2 Size was quite big in size.
Everything indicates that we might have a potential memory leak.
2. Using dotnet-gcdump and Visual Studio to analyze a GC Heap dump
You can use
dotnet-dumpinstead ofdotnet-gcdump, withdotnet-dumpyou will do the following steps:
- Take a Full or a Heap Dump.
- Open it with Visual Studio.
- Start debugging with the “Debug Managed Memory” option.
And you’ll come to the same conclusion as if you were using
dotnet-gcdump.
But there is a catch, to use the “Debug Managed Memory” from Visual Studio you need Visual Studio Enterprise.
The dotnet-gcdump tool collects GC dumps of .NET processes. These dumps are useful for several scenarios:
- Comparing the number of objects on the heap at several points in time.
- Analyzing roots of objects.
- Collecting general statistics about the counts of objects on the heap.
I’m going to apply another load of 100 requests per second during 120 seconds to the memory-leak endpoint with bombardier, and while the load test is running I’ll capture 2 snapshots of the GC Heap.
- Why capture 2 snapshots instead of a single one?
Well, because the easiest way to know what’s going on in the Heap is to take 2 snapshots in different points in time and compare them. That way I’ll be able to see which new objects where added on the Heap between those 2 intervals.
You can capture a snapshot of the GC Heap with this command:
./dotnet-gcdump collect --process-id 1
- The
collectcommand collects a GC dump from a running process. - The
-p|--process-idparameter specifies the process id to collect the trace, in this case we’re inside a docker container so the PID is always 1.
We’re going to analyze those dumps with Visual Studio also, but the dumps are inside the docker container, so I’m going to copy them from inside the container to my local machine using the command:
docker cp <container-id>:<path-to-the-gcdump> .
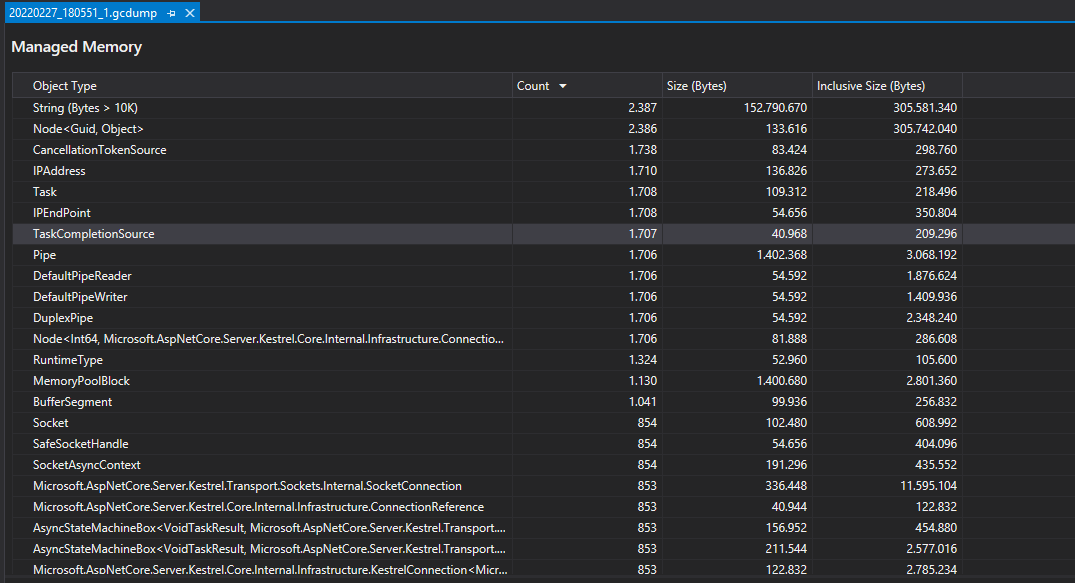
Let’s open the first dump with Visual Studio, it will show us a screen with all the managed objects that were on the Heap.
If we select “Compare to > Browse” on the menu and select the second dump it will shows us the diff between the 2 dump files.
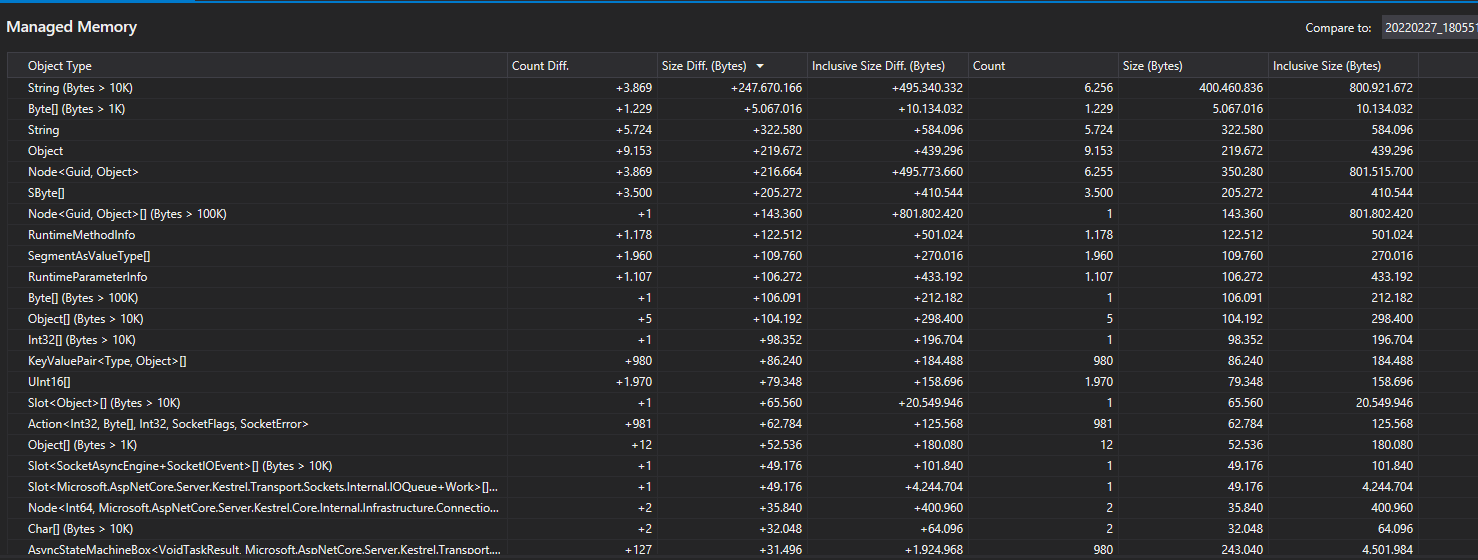
If we order the results by “Size Diff” (Total size difference between the current snapshot and the baseline) those are the top results:
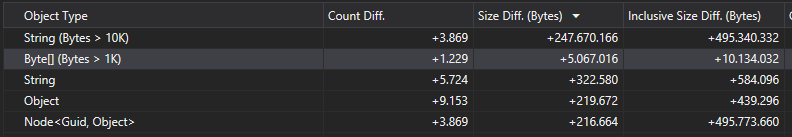
Having strings and objects in the top spots is nothing unusual, any app contains hundreds or even thousands of strings and objects.
The object of type Node<Guid, Object> is far more interesting. First of all, let’s take a look at which types are referenced by this Node<Guid, Object>
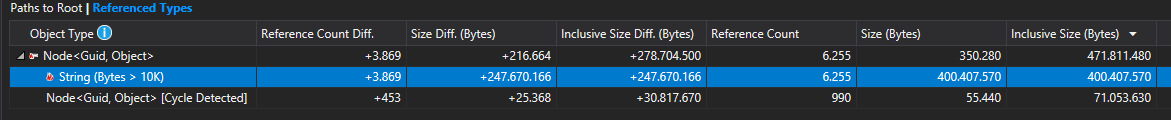
More than 3800 new strings with a reference to the Node<Guid,Object> object were created in the interval of time between the 2 dumps. Also the size of those new strings is quite big, almost 400Mb.
That’s quite a sizeable amount of new strings referencing this particular object, let’s dig deeper and take look at the Roots for this object.
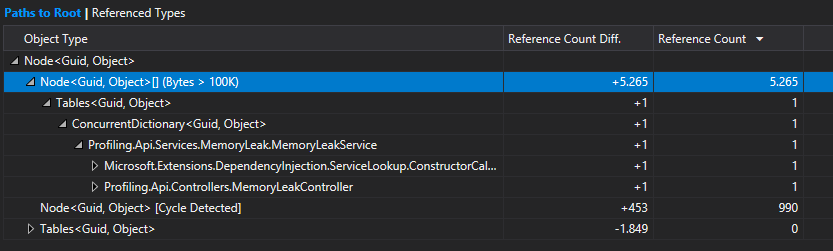
If we take a look at the roots we can see that the Profiling.Api.Service.MemoryLeak.MemoryLeakService (which is a service I have built on our demo app) has a reference to a ConcurrentDictionary<Guid, Object>, and in turn, the ConcurrentDictionary<Guid, Object> has a reference to the Node<Guid,Object>.
The leakage seems to be coming from the ConcurrentDictionary<Guid, Object> on the Profiling.Api.Service.MemoryLeak.MemoryLeakService namespace.
The next step would be to dig in the source code and take a look at what this dictionary is used for, because this behaviour might be completely legitimate and this app needs to work with thousands of new strings from time to time, and instead of a memory leak this is just a poor implementation.