Getting started with OpenTelemetry Metrics in .NET 8. Part 2: Instrumenting the BookStore API
This is a two-part series post.
- Part 1: Key concepts that you should know when using OpenTelemetry Metrics with .NET. If you want to read it, click here.
- Part 2: A practical example of how to add OpenTelemetry Metrics to a real life .NET 8 app and how to visualize those metrics using Prometheus and Grafana.
Just show me the code!
As always, if you don’t care about the post I have uploaded the source code on my Github.
In part 1, we discussed some key concepts of OpenTelemetry Metrics. Now, it’s time to focus on instrumenting a real application.
This is what we are going to build.
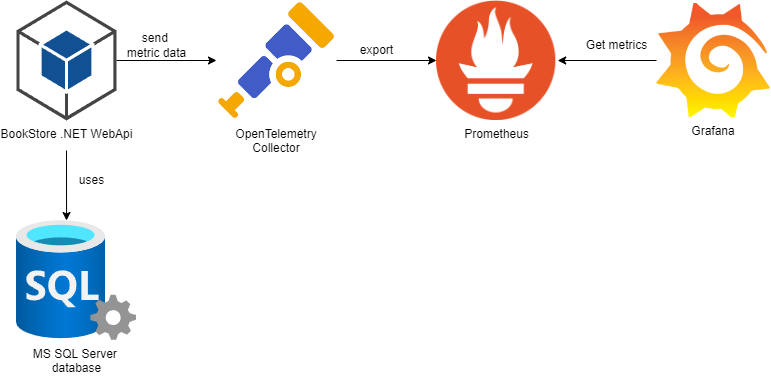
- The BookStore WebAPI will generate some business metrics and use the OTLP exporter package (
OpenTelemetry.Exporter.OpenTelemetryProtocol) to send the metric data to the OpenTelemetry Collector. - Prometheus will obtain the metric data from the OpenTelemetry Collector.
- We will have a Grafana dashboard to visualize the metrics emitted by the BookStore WebApi.
Application
The application we’re going to instrument using OpenTelemetry Metrics is a BookStore API built using .NET 8.
The API can do the following actions:
- Get, add, update and delete book categories.
- Get, add, update and delete books.
- Get, add, update and delete inventory.
- Get, add and update orders.
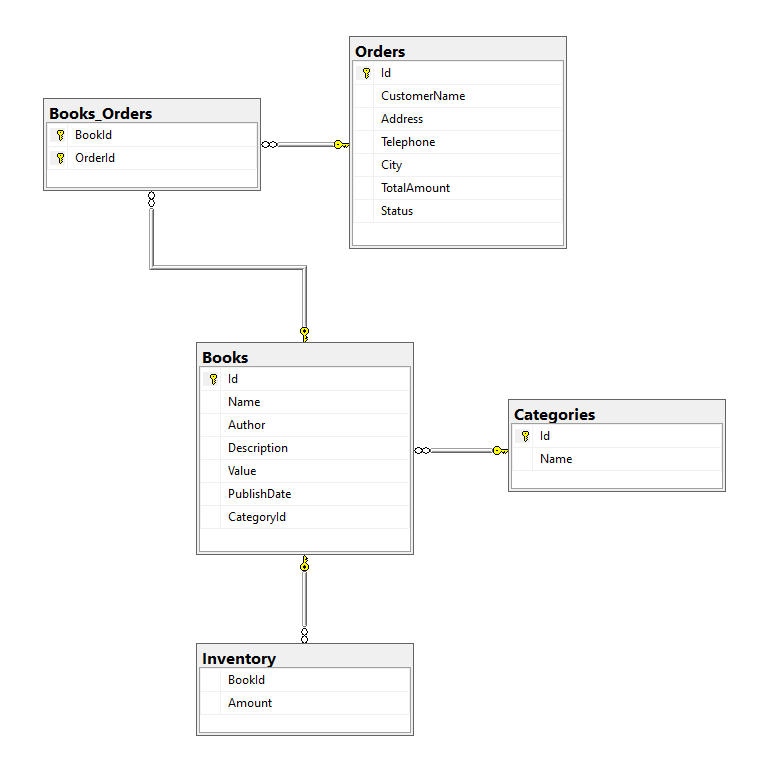
For a better understanding, here’s how the database diagram looks like:
OpenTelemetry Metrics
The first step before writing any code is to decide what we want to measure and what kind of instruments we are going to use.
BookStore API custom metrics
The following business metrics will be instrumented directly on the application using the Metrics API.
BooksAddedCounteris aCounterthat counts books added to the store.BooksDeletedCounteris aCounterthat counts books deleted from the store.BooksUpdatedCounteris aCounterthat counts books updated.TotalBooksUpDownCounteris anUpDownCounterthat contains the total number of books that the store has available at any given time.CategoriesAddedCounteris aCounterthat counts book categories added to the store.CategoriesDeletedCounteris aCounterthat counts book categories deleted from the store.CategoriesUpdatedCounteris aCounterthat counts book categories updated.TotalCategoriesGaugeis anObservableGaugethat contains the total number of book categories that the store has at any given timeOrdersPriceHistogramis aHistogramthat records the price distribution of the orders.NumberOfBooksPerOrderHistogramis aHistogramthat records the number of books distribution per order.OrdersCanceledCounteris anObservableCounterthat counts the total number of orders cancelled.TotalOrdersCounteris aCounterthat counts the total number of orders that the store has received.
.NET built-in metrics
These metrics are generated by the System.Diagnostics.Metrics API and they’re natively built-in on .NET framework starting from .NET 8.
Here’s the full list of the Meters and Instruments built-in the .NET framework.
To start collecting these metrics on your application, there are two options available:
- Install and configure the
OpenTelemetry.Instrumentation.AspNetCoreNuGet package.
To start using the OpenTelemetry.Instrumentation.AspNetCore package you only need to add the AddAspNetCoreInstrumentation() extension method when setting up the .NET OpenTelemetry component. Here’s an example:
builder.Services.AddOpenTelemetry().WithMetrics(opts => opts
        .AddAspNetCoreInstrumentation()
);
This instrumentation library automatically enables all built-in metrics by default. The advantage of using this method is that the AddAspNetCoreInstrumentation() extension simplifies the process of enabling all built-in metrics via a single line of code.
- Manually register the built-in Meters using the
AddMeterextension method.
builder.Services.AddOpenTelemetry().WithMetrics(opts => opts
    .AddMeter("Microsoft.AspNetCore.Hosting")
    .AddMeter("Microsoft.AspNetCore.Server.Kestrel")
    .AddMeter("Microsoft.AspNetCore.Http.Connections")
    .AddMeter("Microsoft.AspNetCore.Routing")
    .AddMeter("Microsoft.AspNetCore.Diagnostics")
    .AddMeter("Microsoft.AspNetCore.RateLimiting")
);
The advantage of using this approach is that it allows us to exert more granular control over which of the built-in metrics we want to emit. Additionally, employing the AddMeter() for metric activation eliminates the necessity to depend on the OpenTelemetry.Instrumentation.AspNetCore instrumentation library.
System.Runtime performance metrics
Those metrics are generated by the OpenTelemetry.Instrumentation.Runtime NuGet package. This is an instrumentation library, which instruments .NET Runtime and collects runtime performance metrics.
There is no need to instrument anything on the application. To start using the OpenTelemetry.Instrumentation.Runtime package you only need to add the AddRuntimeInstrumentation() extension method when setting up the .NET OpenTelemetry MeterProvider component. Here’s an example:
builder.Services.AddOpenTelemetry().WithMetrics(opts => opts
    .AddRuntimeInstrumentation()
);
The OpenTelemetry.Instrumentation.Runtime package collects telemetry about the following System.Runtime counters:
process.runtime.dotnet.gc.collections.count: Number of garbage collections that have occurred since process start.process.runtime.dotnet.gc.objects.size: Count of bytes currently in use by objects in the GC heap that haven’t been collected yet. Fragmentation and other GC committed memory pools are excluded.process.runtime.dotnet.gc.allocations.size: Count of bytes allocated on the managed GC heap since the process startprocess.runtime.dotnet.gc.committed_memory.size: The amount of committed virtual memory for the managed GC heap, as observed during the latest garbage collection.process.runtime.dotnet.gc.heap.size: The heap size (including fragmentation), as observed during the latest garbage collection.process.runtime.dotnet.gc.heap.fragmentation.size: The heap fragmentation, as observed during the latest garbage collection.process.runtime.dotnet.jit.il_compiled.size: Count of bytes of intermediate language that have been compiled since the process start.process.runtime.dotnet.jit.methods_compiled.count: The number of times the JIT compiler compiled a method since the process start.process.runtime.dotnet.jit.compilation_time: The amount of time the JIT compiler has spent compiling methods since the process start.process.runtime.dotnet.monitor.lock_contention.count: The number of times there was contention when trying to acquire a monitor lock since the process start.process.runtime.dotnet.thread_pool.threads.count: The number of thread pool threads that currently exist.process.runtime.dotnet.thread_pool.completed_items.count: The number of work items that have been processed by the thread pool since the process start.process.runtime.dotnet.thread_pool.queue.length: The number of work items that are currently queued to be processed by the thread pool.process.runtime.dotnet.timer.count: The number of timer instances that are currently active.process.runtime.dotnet.assemblies.count: The number of .NET assemblies that are currently loaded.process.runtime.dotnet.exceptions.count: Count of exceptions that have been thrown in managed code, since the observation started.
Some of the GC related metrics will be unavailable until at least one garbage collection has occurred.
Process metrics
Those metrics are generated by the OpenTelemetry.Instrumentation.Process NuGet package. This is an Instrumentation Library, which instruments .NET and collects telemetry about the running process.
To start using the OpenTelemetry.Instrumentation.Process package you only need to add the AddProcessInstrumentation() extension method when setting up the .NET OpenTelemetry component. Here’s an example:
builder.Services.AddOpenTelemetry().WithMetrics(opts => opts
        .AddProcessInstrumentation()
);
The OpenTelemetry.Instrumentation.Process package collects the following metrics of the running process:
process.memory.usage: The amount of physical memory allocated for this process.process.memory.virtual: The amount of committed virtual memory for this process. One way to think of this is all the address space this process can read from without triggering an access violation; this includes memory backed solely by RAM, by a swapfile/pagefile and by other mapped files on disk.process.cpu.time: Total CPU seconds broken down by states.process.cpu.count: The number of processors (CPU cores) available to the current process.process.threads: Process threads count.
OpenTelemetry .NET Client
To get started with OpenTelemetry Metrics we’re going to need the following packages.
<PackageReference Include="OpenTelemetry.Extensions.Hosting" Version="1.7.0-alpha.1" />
<PackageReference Include="OpenTelemetry.Instrumentation.AspNetCore" Version="1.6.0-beta.3" />
<PackageReference Include="OpenTelemetry.Instrumentation.Runtime" Version="1.5.1" />
<PackageReference Include="OpenTelemetry.Instrumentation.Process" Version="0.5.0-beta.3" />
<PackageReference Include="OpenTelemetry.Exporter.OpenTelemetryProtocol" Version="1.7.0-alpha.1" />
- The OpenTelemetry.Extensions.Hosting package contains some extensions that allows us to configure the MeterProvider.
- The OpenTelemetry.Instrumentation.* packages are instrumentation libraries. These packages are instrumenting common libraries/functionalities/classes so we don’t have to do all the heavy lifting by ourselves. In our application we’re using the following ones:
- The OpenTelemetry.Instrumentation.AspNetCore package collects the metrics built into the .NET Framework.
- The OpenTelemetry.Instrumentation.Runtime package collects runtime performance metrics.
- The OpenTelemetry.Instrumentation.Process package collects process metrics.
- The OpenTelemetry.Exporter.OpenTelemetryProtocol package allows us to export the metrics to the OpenTelemetry Collector using the OTLP protocol.
Add OpenTelemetry Metrics on the BookStore app
1 - Setup the MeterProvider
builder.Services.AddOpenTelemetry().WithMetrics(opts => opts
    .SetResourceBuilder(ResourceBuilder.CreateDefault().AddService("BookStore.WebApi"))
    .AddMeter(builder.Configuration.GetValue<string>("BookStoreMeterName"))
    .AddAspNetCoreInstrumentation()
    .AddRuntimeInstrumentation()
    .AddProcessInstrumentation()
    .AddOtlpExporter(opts =>
    {
        opts.Endpoint = new Uri(builder.Configuration["Otlp:Endpoint"]);
    }));
Let’s review what we’re doing, line by line.
AddOpenTelemetry().WithMetrics()
OpenTelemetry Metrics works by using the MeterProvider to create a Meter and associating it with one or more Instruments, each of which is used to create a series of Measurements.
The MeterProvider holds the configuration for metrics like Meter names, Readers or Views. The MeterProvider must be configured using the .WithMetrics() extension method.
The AddOpenTelemetry() is responsible for registering an IHostedService that starts the tracing and metric services.
SetResourceBuilder(ResourceBuilder.CreateDefault().AddService("BookStore.WebApi"))
A Resource is the immutable representation of the entity producing the telemetry.
With the SetResourceBuilder method we’re configuring the Resource for the application.
The SetResourceBuilder gives us the possibility to configure attributes like the service name or the application name amongst others.
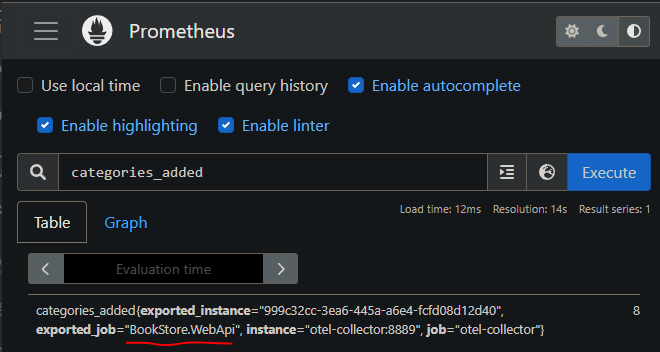
Using the AddService("BookStore.Webapi") method we can set the service name as an attribute of the metric data. For example, if we take a look at the OrdersCanceledCounter instrument on Prometheus, we will see the following information:
.AddMeter(builder.Configuration.GetValue<string>("BookStoreMeterName"))
Any Instrument that we create in our application needs to be associated with a Meter. The AddMeter() extension method configures OpenTelemetry to transmit all the metrics collected by this concrete Meter.
As you’ll see later, in the BookStore app I have a single Meter with multiple Instruments on it, but you can also have multiple Meters in a single application, in that case you’ll need to add multiple calls to the AddMeter() method.
AddAspNetCoreInstrumentation()
This method comes from the OpenTelemetry.Instrumentation.AspNetCore NuGet package, it collects all the metrics built into the .NET Framework.
AddRuntimeInstrumentation()
This method comes from the OpenTelemetry.Instrumentation.Runtime NuGet package, it instruments .NET and collects runtime performance metrics.
AddProcessInstrumentation()
This method comes from the OpenTelemetry.Instrumentation.Process NuGet package, it instruments .NET and collects process related metrics like CPU or memory.
AddOtlpExporter(opts =>
{
    opts.Endpoint = new Uri(builder.Configuration["Otlp:Endpoint"]);
}));
The AddOtlpExporter method is used to configure the exporter that sends all the metric data to the OpenTelemetry Collector.
2 - Create the Meter and Instruments
After setting up the MeterProvider, it’s time to create a Meter and use it to create Instruments.
There are a few ways to do that, but I’m going to show you how I tend to do it.
First of all, I’m going to create a Singleton class that will contain:
- A meter.
- The instruments associated with the meter.
- A series of helper methods to record measurements with those instruments.
The next code snippet shows what the class looks like:
public class BookStoreMetrics
{
    //Books meters
    private  Counter<int> BooksAddedCounter { get; }
    private  Counter<int> BooksDeletedCounter { get; }
    private  Counter<int> BooksUpdatedCounter { get; }
    private  UpDownCounter<int> TotalBooksUpDownCounter { get; }

    //Categories meters
    private Counter<int> CategoriesAddedCounter { get; }
    private Counter<int> CategoriesDeletedCounter { get; }
    private Counter<int> CategoriesUpdatedCounter { get; }
    private ObservableGauge<int> TotalCategoriesGauge { get; }
    private int _totalCategories = 0;

    //Order meters
    private Histogram<double> OrdersPriceHistogram { get; }
    private Histogram<int> NumberOfBooksPerOrderHistogram { get; }
    private ObservableCounter<int> OrdersCanceledCounter { get; }
    private int _ordersCanceled = 0;
    private Counter<int> TotalOrdersCounter { get; }

    public BookStoreMetrics(IMeterFactory meterFactory, IConfiguration configuration)
    {
        var meter = meterFactory.Create(configuration["BookStoreMeterName"] ??
                                        throw new NullReferenceException("BookStore meter missing a name"));

        BooksAddedCounter = meter.CreateCounter<int>("books-added", "Book");
        BooksDeletedCounter = meter.CreateCounter<int>("books-deleted", "Book");
        BooksUpdatedCounter = meter.CreateCounter<int>("books-updated", "Book");
        TotalBooksUpDownCounter = meter.CreateUpDownCounter<int>("total-books", "Book");

        CategoriesAddedCounter = meter.CreateCounter<int>("categories-added", "Category");
        CategoriesDeletedCounter = meter.CreateCounter<int>("categories-deleted", "Category");
        CategoriesUpdatedCounter = meter.CreateCounter<int>("categories-updated", "Category");
        TotalCategoriesGauge = meter.CreateObservableGauge<int>("total-categories", () => _totalCategories);

        OrdersPriceHistogram = meter.CreateHistogram<double>("orders-price", "Euros", "Price distribution of book orders");
        NumberOfBooksPerOrderHistogram = meter.CreateHistogram<int>("orders-number-of-books", "Books", "Number of books per order");
        OrdersCanceledCounter = meter.CreateObservableCounter<int>("orders-canceled", () => _ordersCanceled);
        TotalOrdersCounter = meter.CreateCounter<int>("total-orders", "Orders");
    }

    //Books meters
    public void AddBook() => BooksAddedCounter.Add(1);
    public void DeleteBook() => BooksDeletedCounter.Add(1);
    public void UpdateBook() => BooksUpdatedCounter.Add(1);
    public void IncreaseTotalBooks() => TotalBooksUpDownCounter.Add(1);
    public void DecreaseTotalBooks() => TotalBooksUpDownCounter.Add(-1);

    //Categories meters
    public void AddCategory() => CategoriesAddedCounter.Add(1);
    public void DeleteCategory() => CategoriesDeletedCounter.Add(1);
    public void UpdateCategory() => CategoriesUpdatedCounter.Add(1);
    public void IncreaseTotalCategories() => _totalCategories++;
    public void DecreaseTotalCategories() => _totalCategories--;

    //Orders meters
    public void RecordOrderTotalPrice(double price) => OrdersPriceHistogram.Record(price);
    public void RecordNumberOfBooks(int amount) => NumberOfBooksPerOrderHistogram.Record(amount);
    public void IncreaseOrdersCanceled() => _ordersCanceled++;
    public void IncreaseTotalOrders(string city) => TotalOrdersCounter.Add(1, KeyValuePair.Create<string, object>("City", city));
}
In the class constructor, we create the meter using the IMeterFactory interface and then use it to create every necessary instrument. Additionally, we create a series of public helper methods to record measurements.
- Why create all these helper methods (AddBook, DeleteBook, UpdateBook, etc, etc)?
To improve code readability, it is easier to understand what this line of code meters.AddBook() is doing, rather than this other one BooksAddedCounter.Add(1).
3 - Record measurements using the instruments
Now it’s time to use the instruments we have created in the previous section to start recording measurements.
You just need to inject the BookStoreMetrics class whenever you want to record a measurement and utilize any of the helper methods exposed on it.
In the following code snippets, I’ll be using C# 12 primary constructors feature to inject a
BookStoreMetricsinstance. Keep that in mind if you try to replicate the code.
Record book metrics
- Every time a new book gets added into the database.
- Increase +1 the
BooksAddedCounterinstrument and increase +1 theTotalBooksUpDownCounterinstrument.
- Increase +1 the
- Every time a new book gets updated.
- Increase +1 the
BooksUpdatedCounterinstrument.
- Increase +1 the
- Every time a new book gets deleted from the database.
- Increase +1 the
BooksDeletedCounterinstrument and decrease -1 theTotalBooksUpDownCounterinstrument.
- Increase +1 the
The next snippet of code shows how to record those measurements every time a book gets added, updated or deleted from the database.
public class BookRepository(BookStoreDbContext context,
      BookStoreMetrics meters) : Repository<Book>(context), IBookRepository
{
    public override async Task<List<Book>> GetAll()
    {
        return await Db.Books.Include(b => b.Category)
            .OrderBy(b => b.Name)
            .ToListAsync();
    }

    public override async Task<Book> GetById(int id)
    {
        return await Db.Books.Include(b => b.Category)
            .Where(b => b.Id == id)
            .FirstOrDefaultAsync();
    }

    public async Task<IEnumerable<Book>> GetBooksByCategory(int categoryId)
    {
        return await Search(b => b.CategoryId == categoryId);
    }

    public async Task<IEnumerable<Book>> SearchBookWithCategory(string searchedValue)
    {
        return await Db.Books.AsNoTracking()
            .Include(b => b.Category)
            .Where(b => b.Name.Contains(searchedValue) ||
                        b.Author.Contains(searchedValue) ||
                        b.Description.Contains(searchedValue) ||
                        b.Category.Name.Contains(searchedValue))
            .ToListAsync();
    }

    public override async Task Add(Book entity)
    {
        await base.Add(entity);

        meters.AddBook();
        meters.IncreaseTotalBooks();
    }

    public override async Task Update(Book entity)
    {
        await base.Update(entity);

        meters.UpdateBook();
    }

    public override async Task Remove(Book entity)
    {
        await base.Remove(entity);

        meters.DeleteBook();
        meters.DecreaseTotalBooks();
    }
}
Record book categories metrics
- Every time a new book category gets added into the database.
- Increase +1 the
CategoriesAddedCounterinstrument and increase +1 theTotalCategoriesGaugeinstrument.
- Increase +1 the
- Every time a new book category gets updated.
- Increase +1 the
CategoriesUpdatedCounterinstrument.
- Increase +1 the
- Every time a new book category gets deleted from the database.
- Increase +1 the
CategoriesDeletedCounterinstrument and decrease -1 theTotalCategoriesGaugeinstrument.
- Increase +1 the
The next snippet of code shows how to record those measurements every time a book category gets added, updated or deleted from the database.
public class CategoryRepository(BookStoreDbContext context,
      BookStoreMetrics meters) : Repository<Category>(context), ICategoryRepository
{
    public override async Task Add(Category entity)
    {
        await base.Add(entity);
        meters.AddCategory();
        meters.IncreaseTotalCategories();
    }

    public override async Task Update(Category entity)
    {
        await base.Update(entity);
        meters.UpdateCategory();
    }

    public override async Task Remove(Category entity)
    {
        await base.Remove(entity);
        meters.DeleteCategory();
        meters.DecreaseTotalCategories();
    }
}
Record orders metrics
- Every time a new order gets added into the database.
- Increase +1 the
TotalOrdersCounterinstrument. - Record the order total price using the
OrdersPriceHistograminstrument. - Record the amount of books in the order using the
NumberOfBooksPerOrderHistograminstrument.
- Increase +1 the
- Every time a new order gets updated.
- Increase +1 the
OrdersCanceledCounterinstrument.
- Increase +1 the
The next snippet of code shows how to record those measurements every time an order gets added or updated.
public class OrderRepository(BookStoreDbContext context,
      BookStoreMetrics meters) : Repository<Order>(context), IOrderRepository
{
    public override async Task<Order> GetById(int id)
    {
        return await Db.Orders
            .Include(b => b.Books)
            .FirstOrDefaultAsync(x => x.Id == id);
    }

    public override async Task<List<Order>> GetAll()
    {
        return await Db.Orders
            .Include(b => b.Books)
            .ToListAsync();
    }

    public override async Task Add(Order entity)
    {
        DbSet.Add(entity);
        await base.SaveChanges();

        meters.RecordOrderTotalPrice(entity.TotalAmount);
        meters.RecordNumberOfBooks(entity.Books.Count);
        meters.IncreaseTotalOrders(entity.City);
    }

    public override async Task Update(Order entity)
    {
        await base.Update(entity);

        meters.IncreaseOrdersCanceled();
    }

    public async Task<List<Order>> GetOrdersByBookId(int bookId)
    {
        return await Db.Orders.AsNoTracking()
            .Include(b => b.Books)
            .Where(x => x.Books.Any(y => y.Id == bookId))
            .ToListAsync();

    }
}
As you can see from the snippets of code in this section, recording a measurement is a really simple task. Just invoke the instrument function wherever you want to record a measurement, and that’s it!
4 - Setup the Histogram bucket aggregation accordingly
A Histogram is a graphical representation of the distribution of numerical data. It groups values into buckets and then counts how many values fall into each bucket.
When using a Histogram instrument, it’s important to make sure the buckets are also configured properly. The bucket histogram aggregation default values are [ 0, 5, 10, 25, 50, 75, 100, 250, 500, 1000 ], and that’s not always ideal.
In the BookStore app we are using 2 Histograms:
OrdersPriceHistogram: Shows the price distribution of the orders.NumberOfBooksPerOrderHistogram: Shows the number of books per order distribution.
For the NumberOfBooksPerOrderHistogram makes no sense using the bucket aggregation default values because no one is going to make an order that contains 250, 500 or 1000 books. And the same could be said for the OrdersPriceHistogram.
To customize the bucket aggregation values accordingly to every Histogram we need to use a View.
A View in OpenTelemetry defines an aggregation, which takes a series of measurements and expresses them as a single metric value at that point in time.
To create a View we can use the AddView extension method from the MeterProvider. Like this:
builder.Services.AddOpenTelemetry().WithMetrics(opts => opts
    .SetResourceBuilder(ResourceBuilder.CreateDefault().AddService("BookStore.WebApi"))
    .AddMeter(meters.MetricName)
    .AddAspNetCoreInstrumentation()
    .AddRuntimeInstrumentation()
    .AddProcessInstrumentation()
    .AddView(
        instrumentName: "orders-price",
        new ExplicitBucketHistogramConfiguration { Boundaries = new double[] { 15, 30, 45, 60, 75 } })
    .AddView(
        instrumentName: "orders-number-of-books",
        new ExplicitBucketHistogramConfiguration { Boundaries = new double[] { 1, 2, 5 } })
    .AddOtlpExporter(options  =>
    {
        options.Endpoint = new Uri(builder.Configuration["Otlp:Endpoint"]
                                   ?? throw new InvalidOperationException());
    }));
5 - Test the BookStore custom metrics
Starting from .NET 8, it is possible to test any custom metric using the Microsoft.Extensions.Diagnostics.Testing NuGet package and the MetricCollector implementation.
The MetricCollector class makes it easy to record the Measurements from specific Instruments and assert the values were correct.
I’m going to build a few unit tests as examples so that you can see how the MetricCollector works. These tests will be very simple, we’ll just interact with different Instruments from the BookStore API and validate that the results are correct.
In a real application, we would obviously want to test the business logic of our application in addition to the custom metrics. However, to make it as simple to understand as possible, I will set up a series of tests where I’ll only interact with the metrics.
Let’s build a few tests and then discuss the most interesting parts of each one of them.
public class BookStoreMetricsTests
{
    private static IServiceProvider CreateServiceProvider()
    {
        var serviceCollection = new ServiceCollection();
        var config = CreateIConfiguration();
        serviceCollection.AddMetrics();
        serviceCollection.AddSingleton(config);
        serviceCollection.AddSingleton<BookStore.Infrastructure.Metrics.BookStoreMetrics>();
        return serviceCollection.BuildServiceProvider();
    }

    private static IConfiguration CreateIConfiguration()
    {
        var inMemorySettings = new Dictionary<string, string> {
            {"BookStoreMeterName", "BookStore"}
        };

        return new ConfigurationBuilder()
            .AddInMemoryCollection(inMemorySettings!)
            .Build();
    }

    [Fact]
    public void GivenTheTotalNumberOfBooksOnTheStore_WhenWeRecordThemOnAHistogram_ThenTheValueGetsRecordedSuccessfully()
    {
        //Arrange
        var services = CreateServiceProvider();
        var metrics = services.GetRequiredService<BookStore.Infrastructure.Metrics.BookStoreMetrics>();
        var meterFactory = services.GetRequiredService<IMeterFactory>();
        var collector = new MetricCollector<int>(meterFactory, "BookStore", "orders-number-of-books");

        // Act
        metrics.RecordNumberOfBooks(35);

        // Assert
        var measurements = collector.GetMeasurementSnapshot();
        Assert.Equal(35, measurements[0].Value);
    }
}
The CreateServiceProvider() and CreateIConfiguration() methods are meant to configure the DI to obtain an instance of the IMeterFactory and one instance of the BookStoreMetrics.
Once we have them, we initialize the MetricCollector with the name of the Meter (BookStore) and the name of theInstrument (order-number-of-books) that we want to record.
The next step is to interact with the Instrument we want to test and generate Measurements with it.
And the last step is to capture a snapshot of the Measurements using the GetMeasurementSnapshot method from the MetricCollector and assert the value.
[Fact]
public void GivenASetOfBooks_WhenWeIncreaseAndDecreaseTheInventory_ThenTheTotalAmountOfBooksIsRecordedSuccessfully()
{
    //Arrange
    var services = CreateServiceProvider();
    var metrics = services.GetRequiredService<BookStore.Infrastructure.Metrics.BookStoreMetrics>();
    var meterFactory = services.GetRequiredService<IMeterFactory>();
    var collector = new MetricCollector<int>(meterFactory, "BookStore", "total-books");

    // Act
    metrics.IncreaseTotalBooks();
    metrics.IncreaseTotalBooks();
    metrics.DecreaseTotalBooks();
    metrics.IncreaseTotalBooks();
    metrics.IncreaseTotalBooks();
    metrics.DecreaseTotalBooks();
    metrics.DecreaseTotalBooks();
    metrics.IncreaseTotalBooks();

    // Assert
    var measurements = collector.GetMeasurementSnapshot();
    Assert.Equal(2, measurements.EvaluateAsCounter());
}
In this test, we increment and decrement the metric specifying the total number of books available in the store.
After completing the interaction with the Instrument, we capture a snapshot of the Measurements using the GetMeasurementSnapshot method and verify the current value using the EvaluateAsCounter method.
To assert this test, we need to use the EvaluateAsCounter method instead of the Value property. This is because we want the resulting value of the metric after incrementing and decrementing it multiple times. The Value property contains the series of individual values, but not the total value.
[Fact]
public void GivenSomeNewBookOrders_WhenWeIncreaseTheTotalOrdersCounter_ThenTheCountryGetsStoredAsATag()
{
    //Arrange
    var services = CreateServiceProvider();
    var metrics = services.GetRequiredService<BookStore.Infrastructure.Metrics.BookStoreMetrics>();
    var meterFactory = services.GetRequiredService<IMeterFactory>();
    var collector = new MetricCollector<int>(meterFactory, "BookStore", "total-orders");

    // Act
    metrics.IncreaseTotalOrders("Barcelona");
    metrics.IncreaseTotalOrders("Paris");

    // Assert
    var measurements = collector.GetMeasurementSnapshot();
    Assert.True(measurements.ContainsTags("City").Any());
    Assert.Equal(2, measurements.EvaluateAsCounter());
}
In this test, we increment the metric specifying the total number of orders. This metric is associated with a tag that specifies the city where the order was made.
After completing the interaction with the Instrument, we capture a snapshot of the Measurements using the GetMeasurementSnapshot method and verify that the snapshot contains the City tag. Just like in the previous test, we also verify the resulting value of the metric using the EvaluateAsCounter method.
[Fact]
public void GivenSomeNewBookCategories_WhenWeIncreaseAndDecreaseTheObservableGauge_ThenTheLastMeasurementOnTheCollectorIsCorrect()
{
    //Arrange
    var services = CreateServiceProvider();
    var metrics = services.GetRequiredService<BookStore.Infrastructure.Metrics.BookStoreMetrics>();
    var meterFactory = services.GetRequiredService<IMeterFactory>();
    var collector = new MetricCollector<int>(meterFactory, "BookStore", "total-categories");

    // Act
    metrics.IncreaseTotalCategories();
    metrics.DecreaseTotalCategories();
    metrics.IncreaseTotalCategories();
    metrics.IncreaseTotalCategories();

    // Assert
    collector.RecordObservableInstruments();
    Assert.Equal(2, collector.LastMeasurement?.Value);
}
In this test, we increment and decrement the metric specifying the total number of book categories.
The “total-categories” Instrument is an Observable Gauge, which means that we cannot take a snapshot. Instead, we must use the RecordObservableInstruments() method to obtain and verify its current value.
OpenTelemetry Collector
The OpenTelemetry Collector consists of three components:
Receivers: Can be push or pull based, is how data gets into the Collector.Processors: Run on data between being received and being exported.Exporters: Can be push or pull based, is how you send data to one or more backends/destinations.
In this case, the OpenTelemetry Collector receives metrics from the BookStore API via gRPC and exports them into Prometheus.
Here’s how the OTEL Collector config file looks like:
receivers:
  otlp:
    protocols:
      grpc:

exporters:
  prometheus:
    endpoint: "0.0.0.0:8889"

processors:
  batch:

extensions:
  health_check:

service:
  extensions: [health_check]
  pipelines:
    metrics:
      receivers: [otlp]
      processors: [batch]
      exporters: [prometheus]
Prometheus
Prometheus must be configured to scrape the OpenTelemetry Collector metrics endpoints.
global:
  scrape_interval: 15s

scrape_configs:
  - job_name: 'otel-collector'
    scrape_interval: 5s
    static_configs:
      - targets: ['otel-collector:8889']
      - targets: ['otel-collector:8888']
After setting up Prometheus, we are going to generate traffic on the BookStore API and afterwards access Prometheus to start analyzing the metrics that the app is sending us.
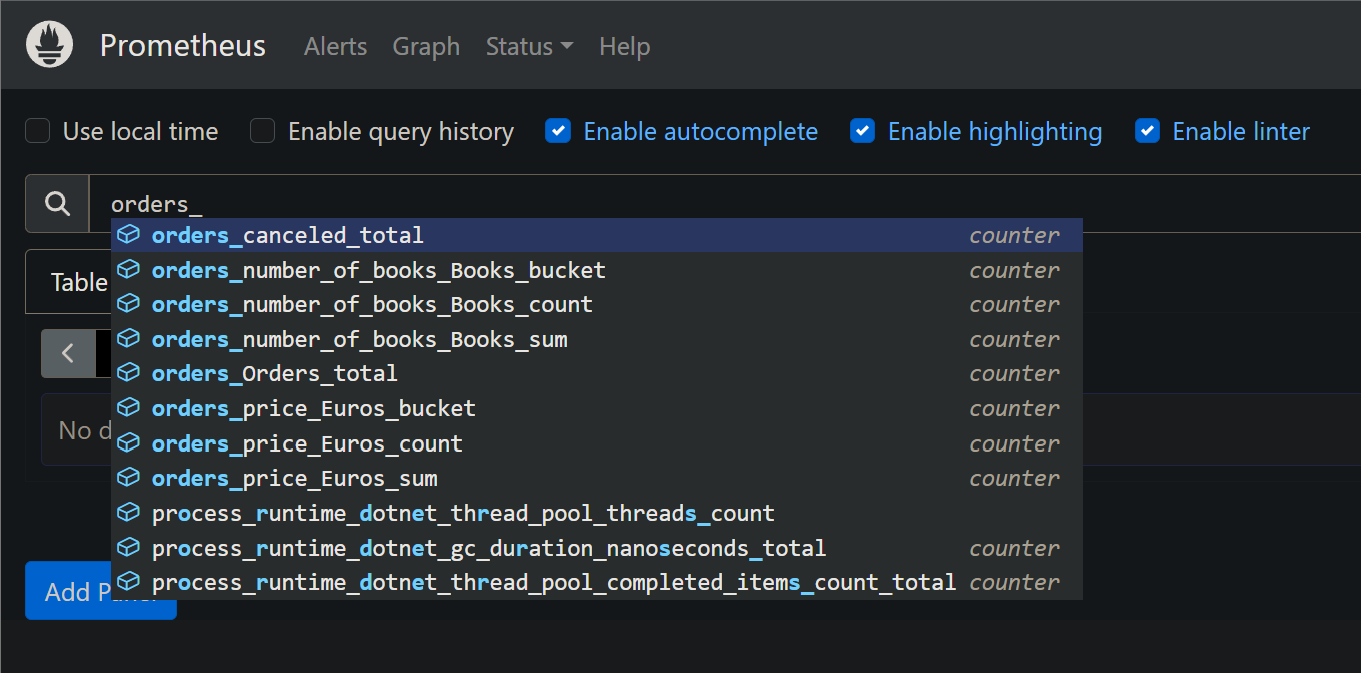
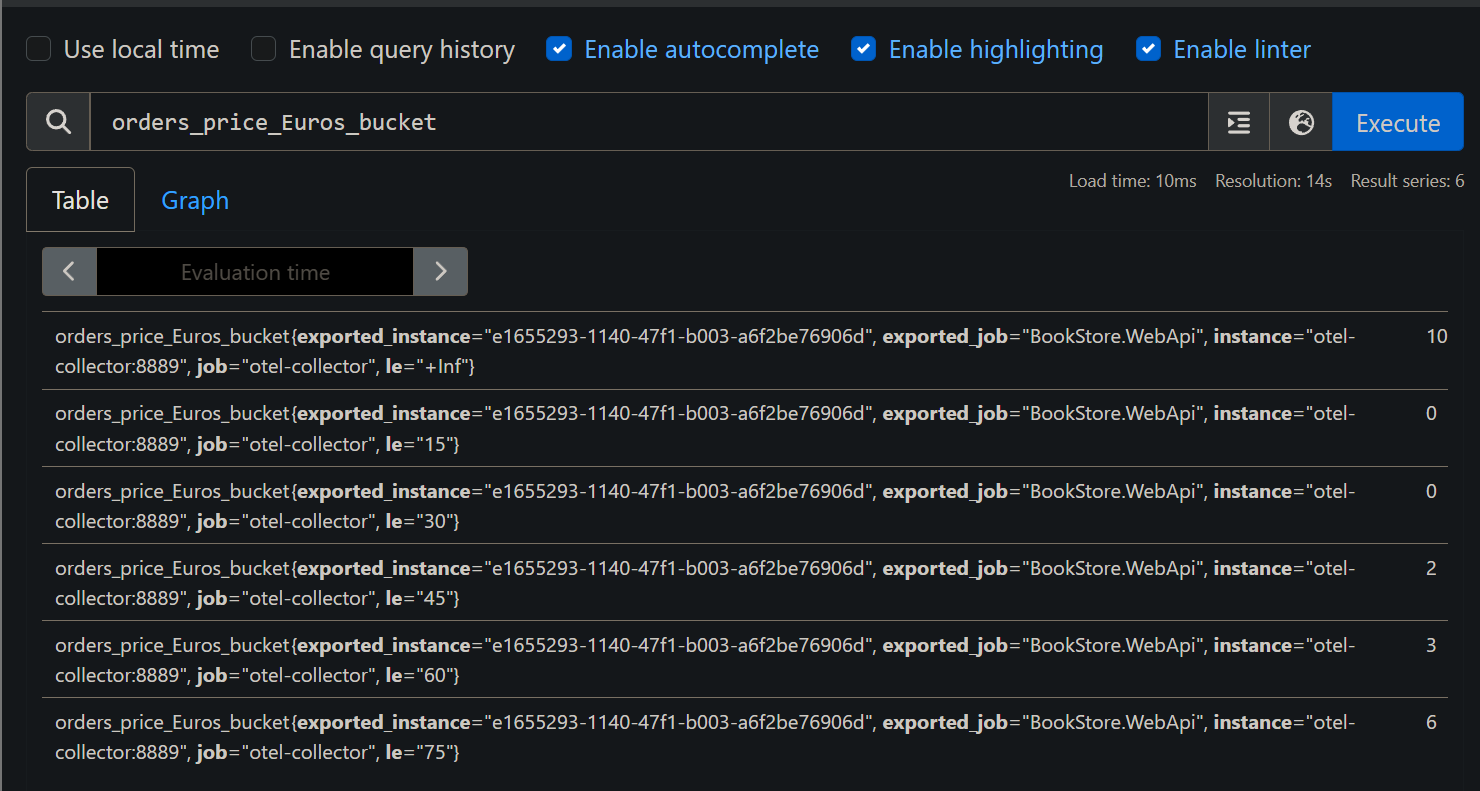
The business metrics from the BookStore API are all available in Prometheus.
If we take a peek at the “orders-price” Histogram we can see that the bucket aggregation values are the correct ones that we defined in the MeterProvider using the AddView extension method.
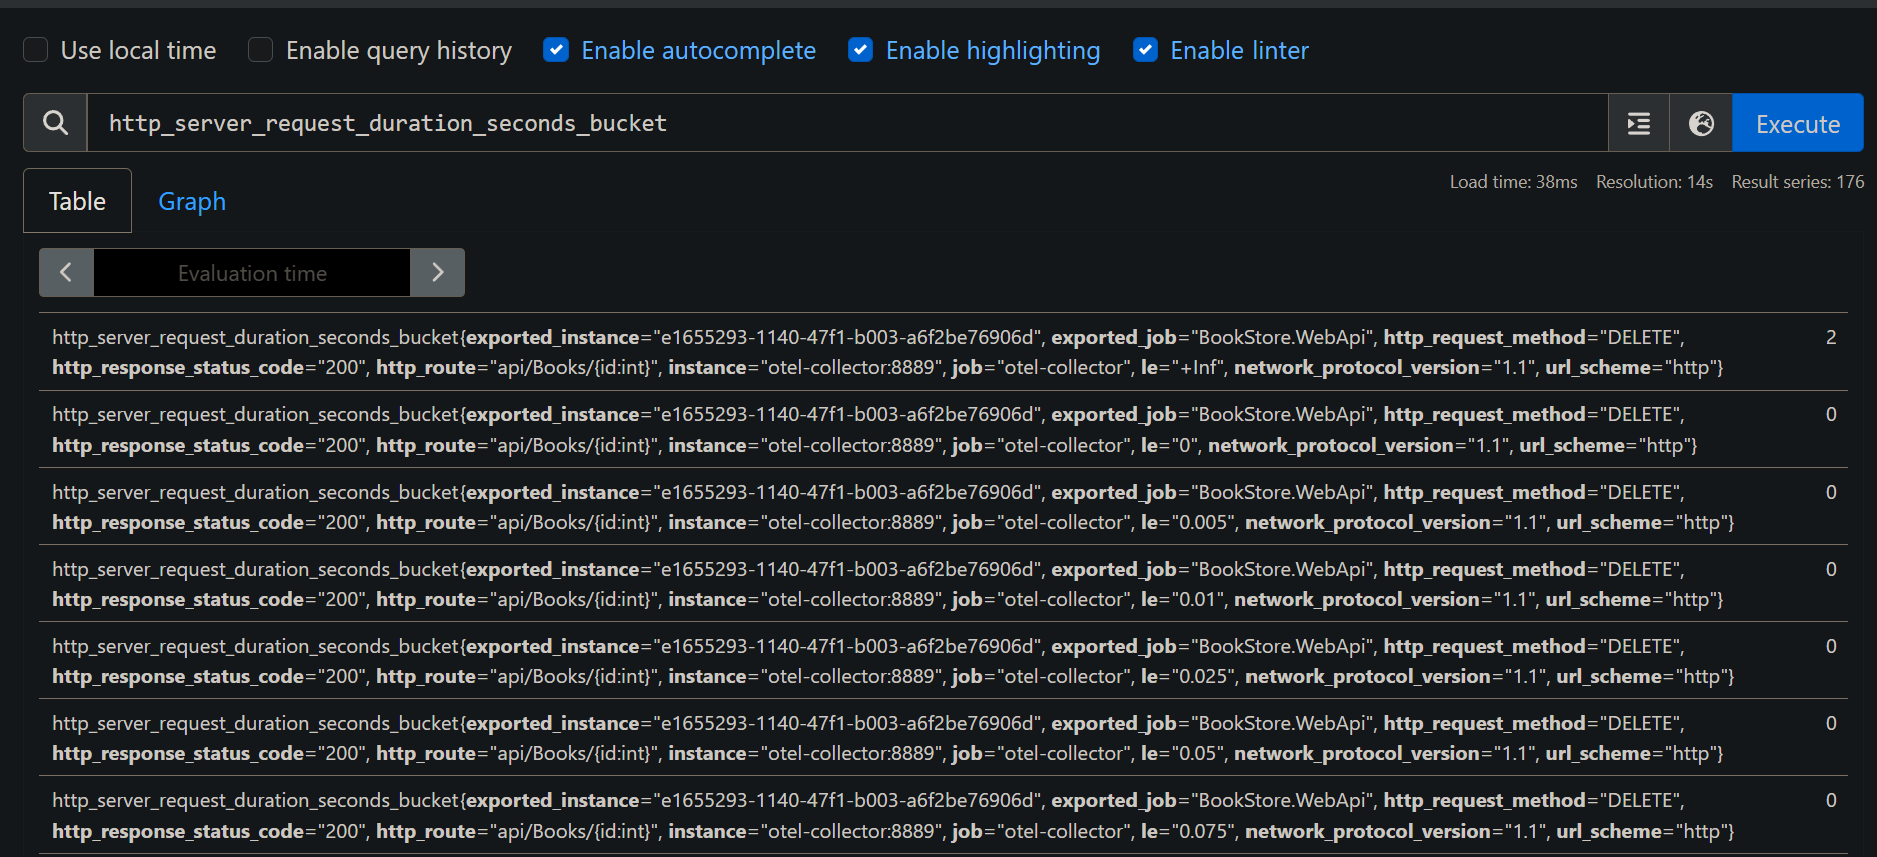
The metrics built into the .NET Framework are also available on Prometheus.
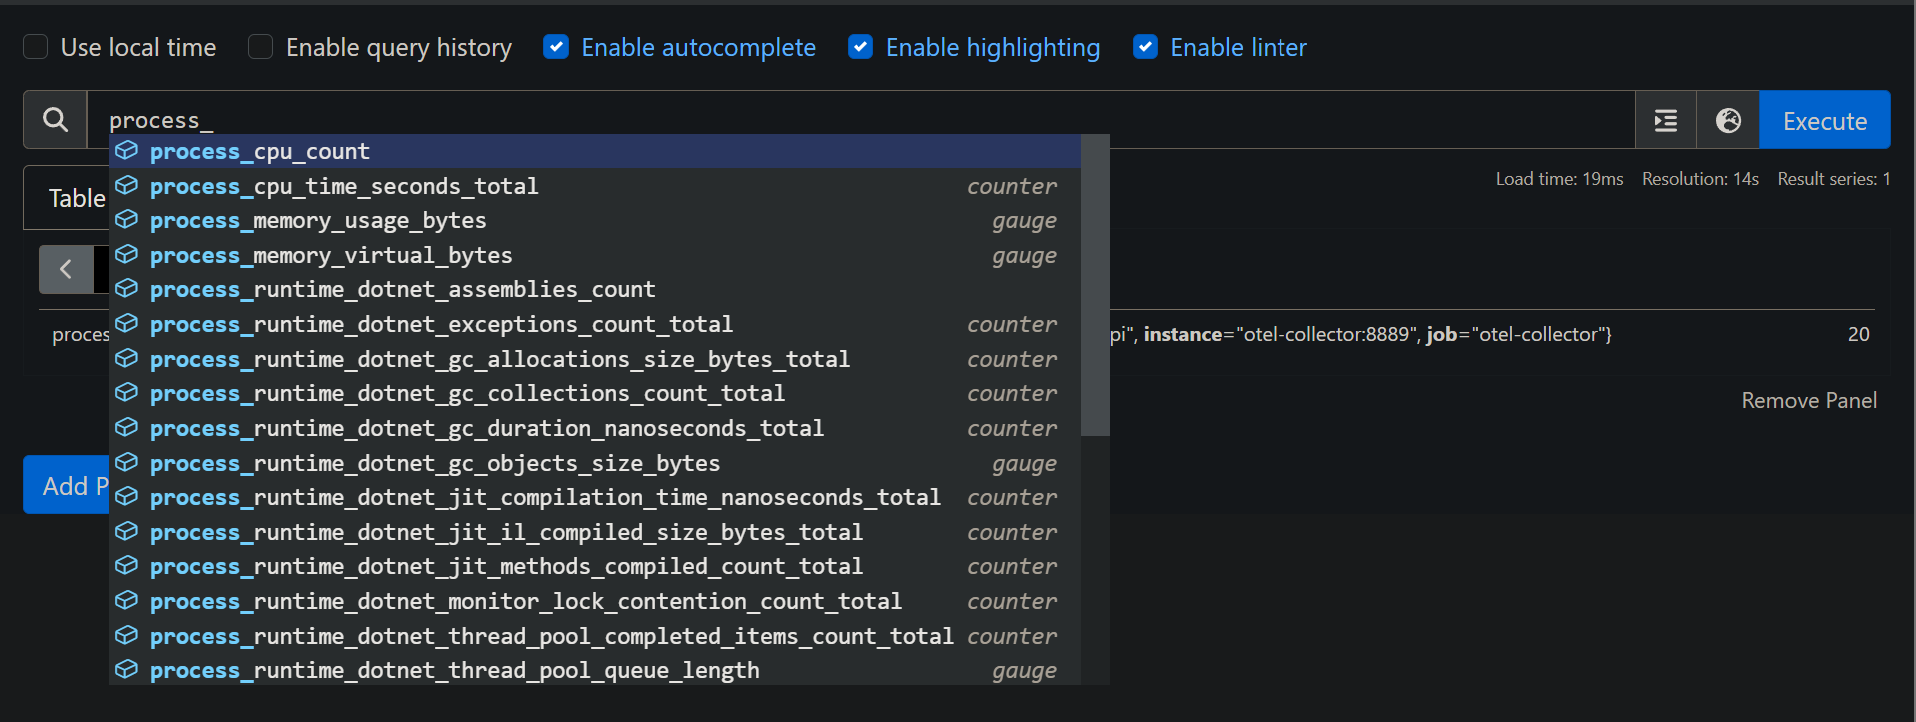
The metrics generated by the OpenTelemetry.Instrumentation.Runtime and the OpenTelemetry.Instrumentation.Process packages are also being ingested by Prometheus.
Grafana
Having the metric data from the BookStore API in Prometheus is great, but we need to visualize them in a friendly manner. Let’s build a few Grafana dashboards.
Not going to explain how to build a Grafana dashboard, that’s out of the scope for this post.
I ended up building 3 dashboards.
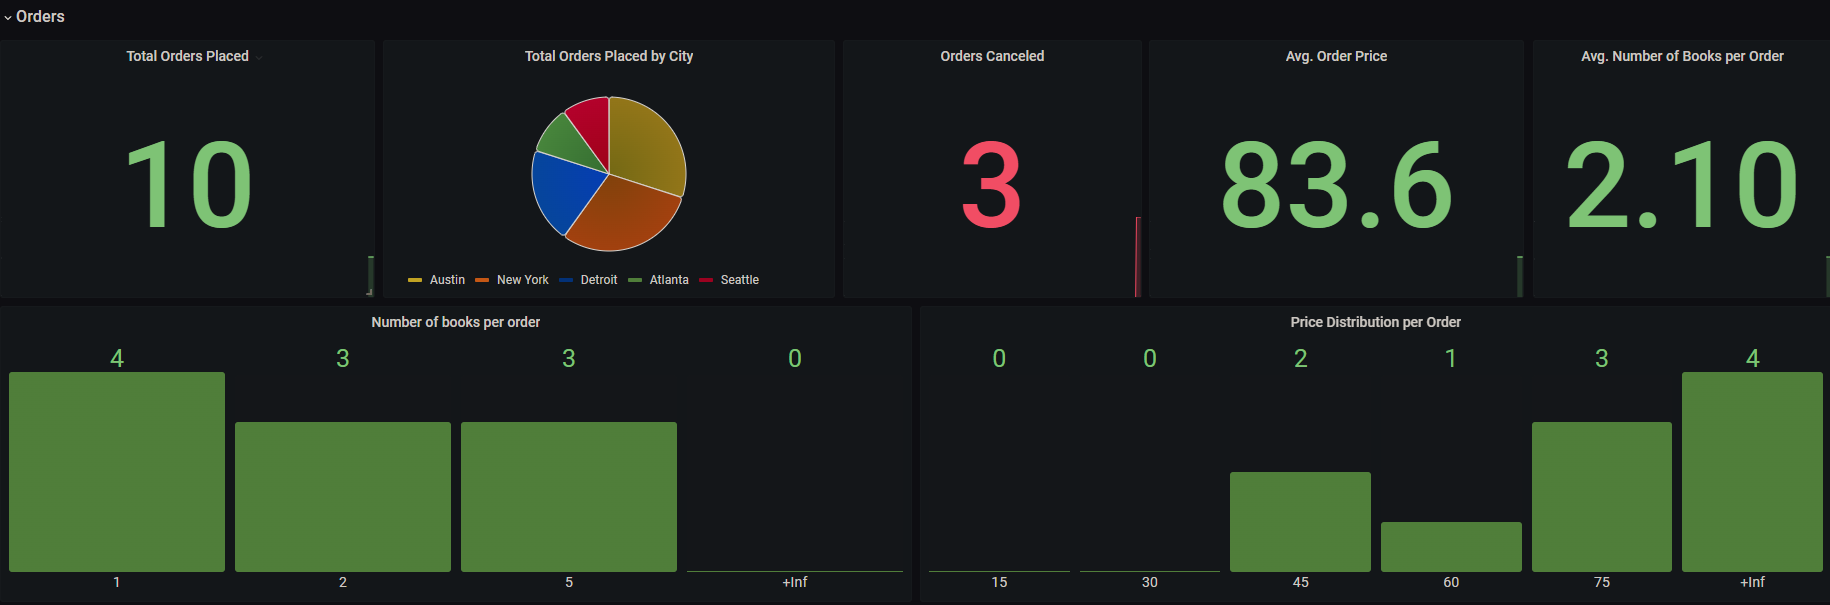
Custom metrics dashboard
This dashboard uses the business metrics instrumented directly on the application using the Metrics API.
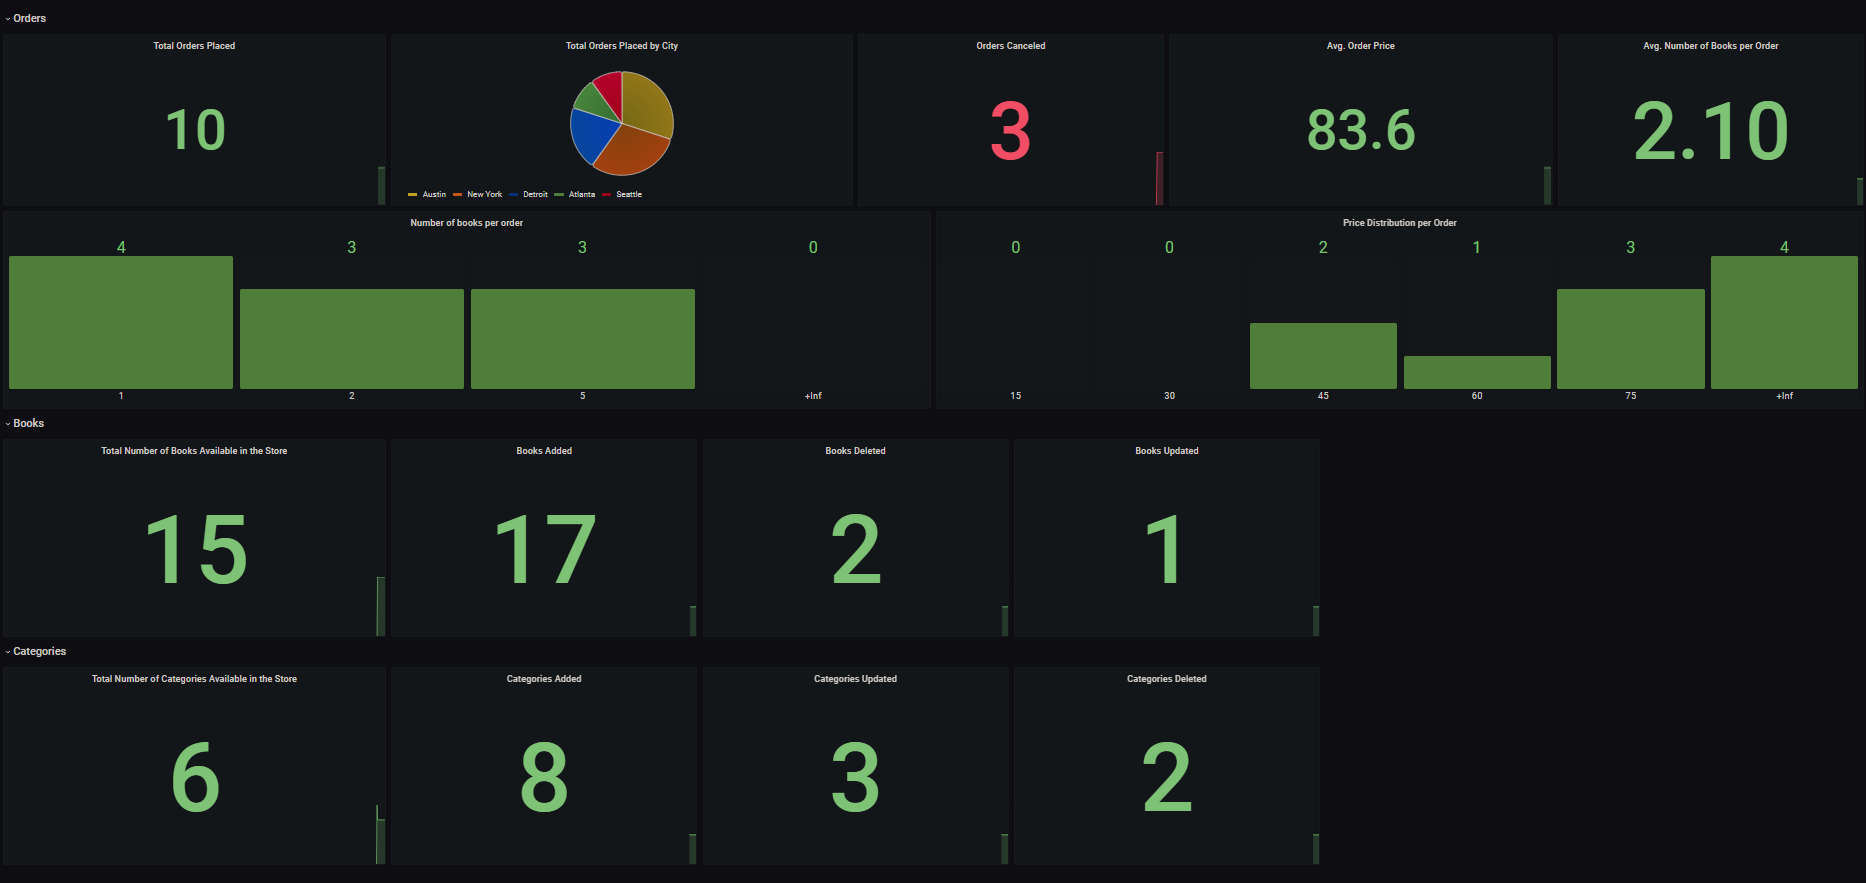
Here’s a closer look of how the “Orders” panel from the dashboard look like:
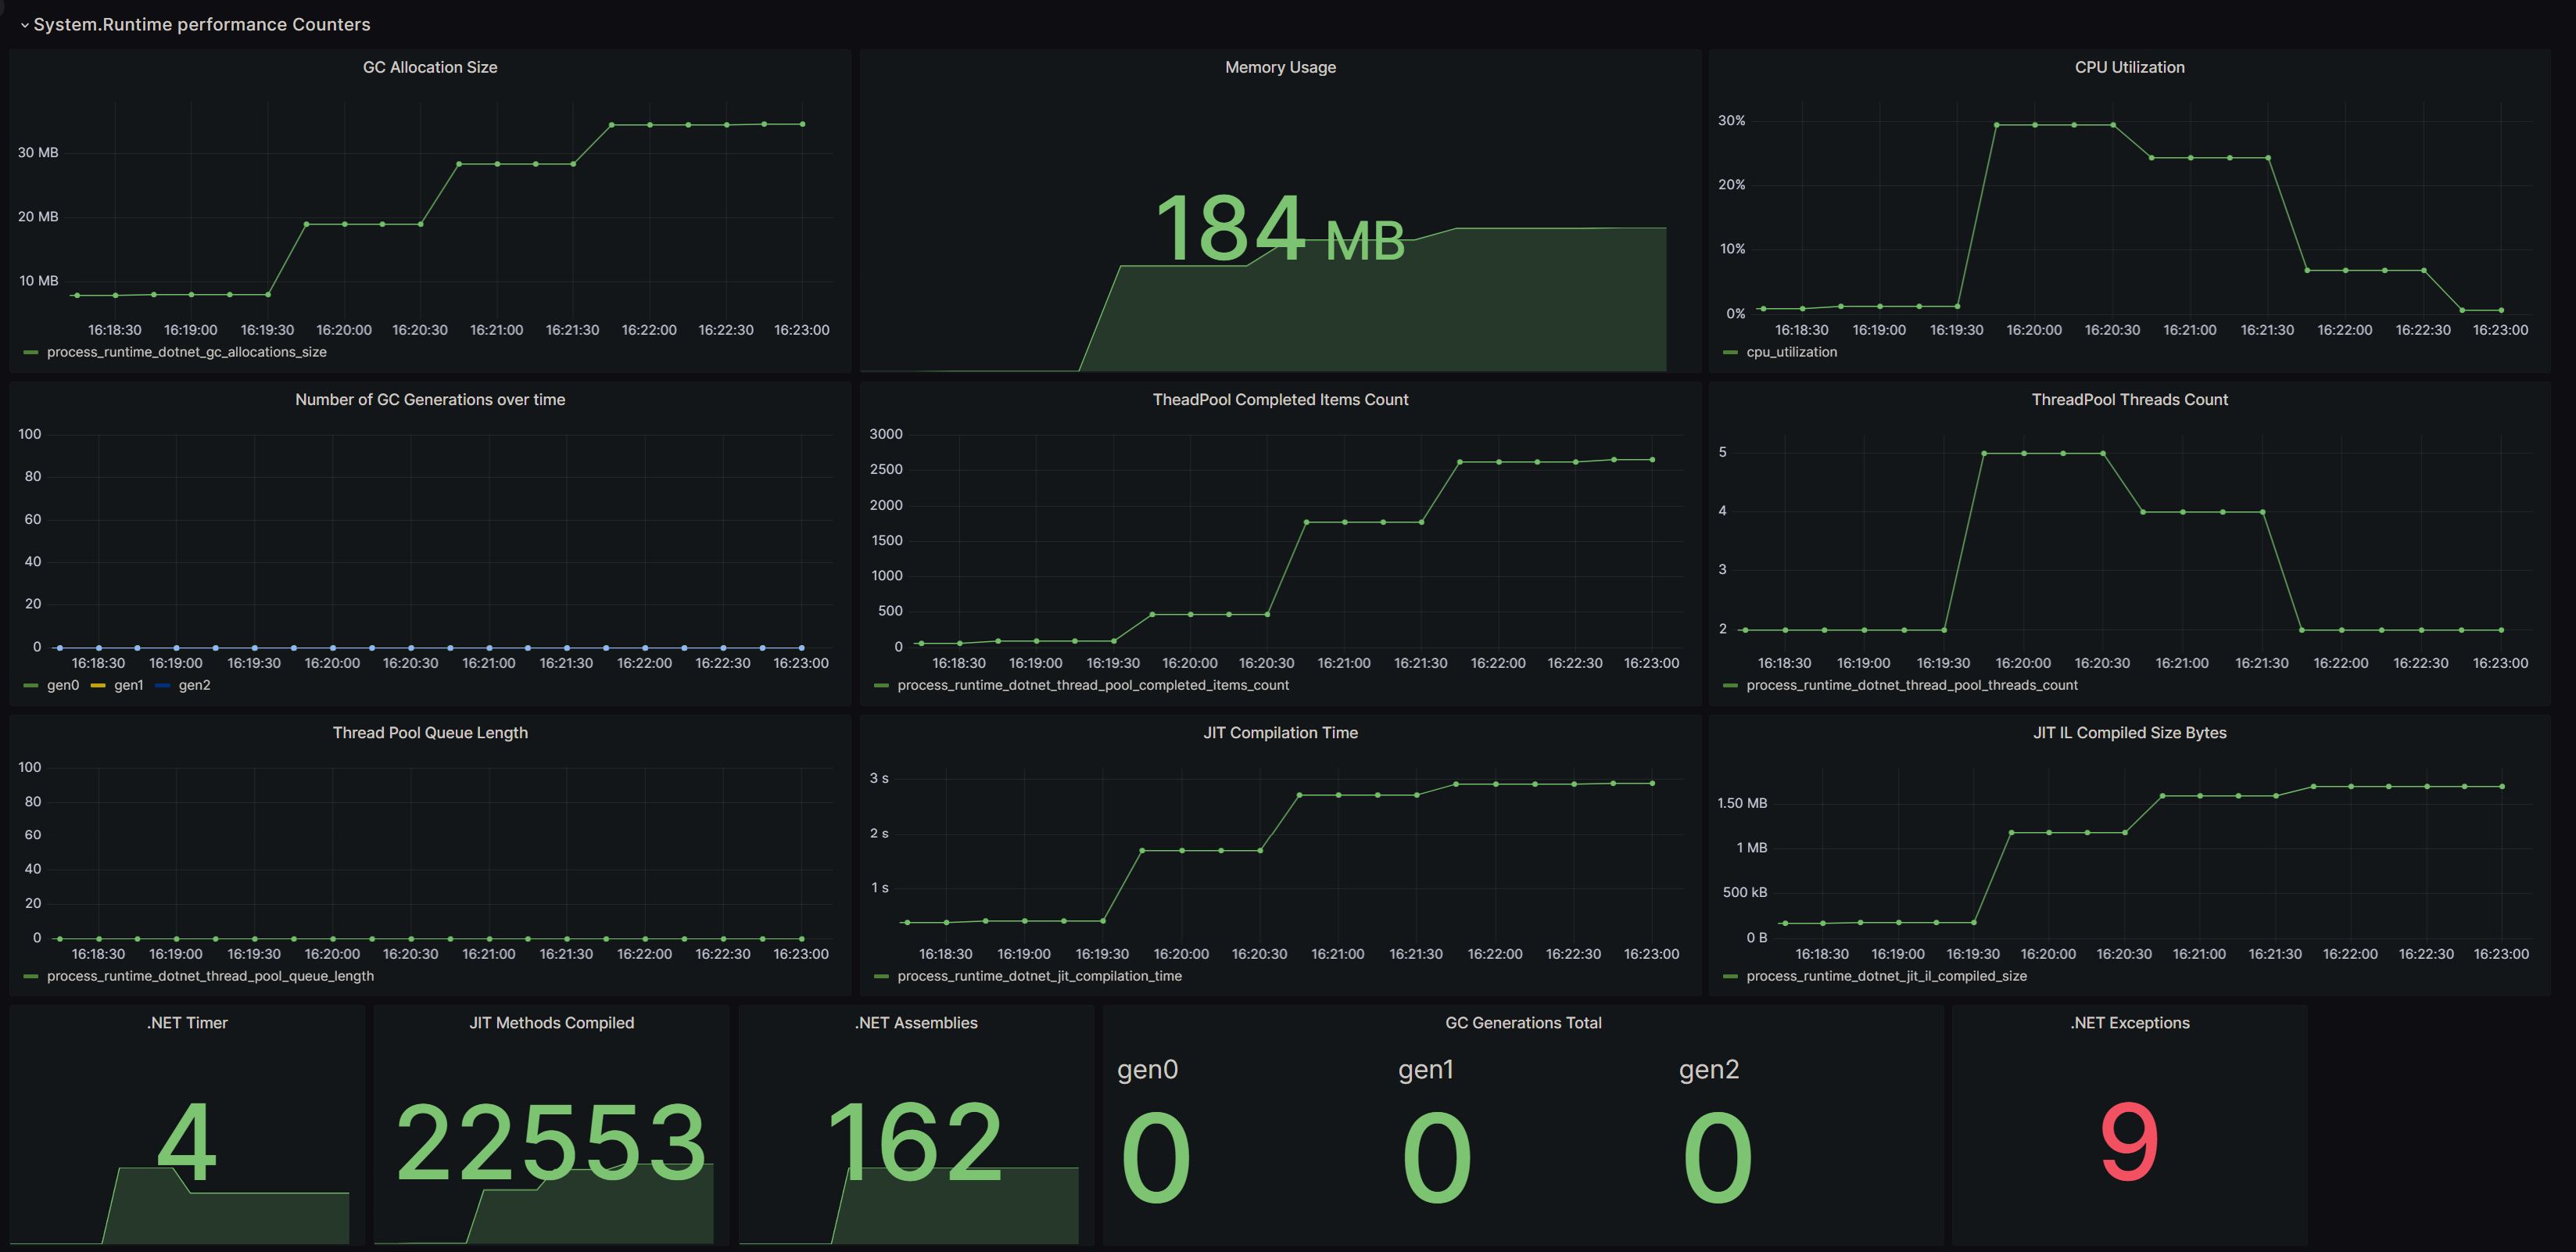
Performance counters & process metrics dashboard
This dashboard uses metrics generated by the OpenTelemetry.Instrumentation.Runtime and the OpenTelemetry.Instrumentation.Process packages.
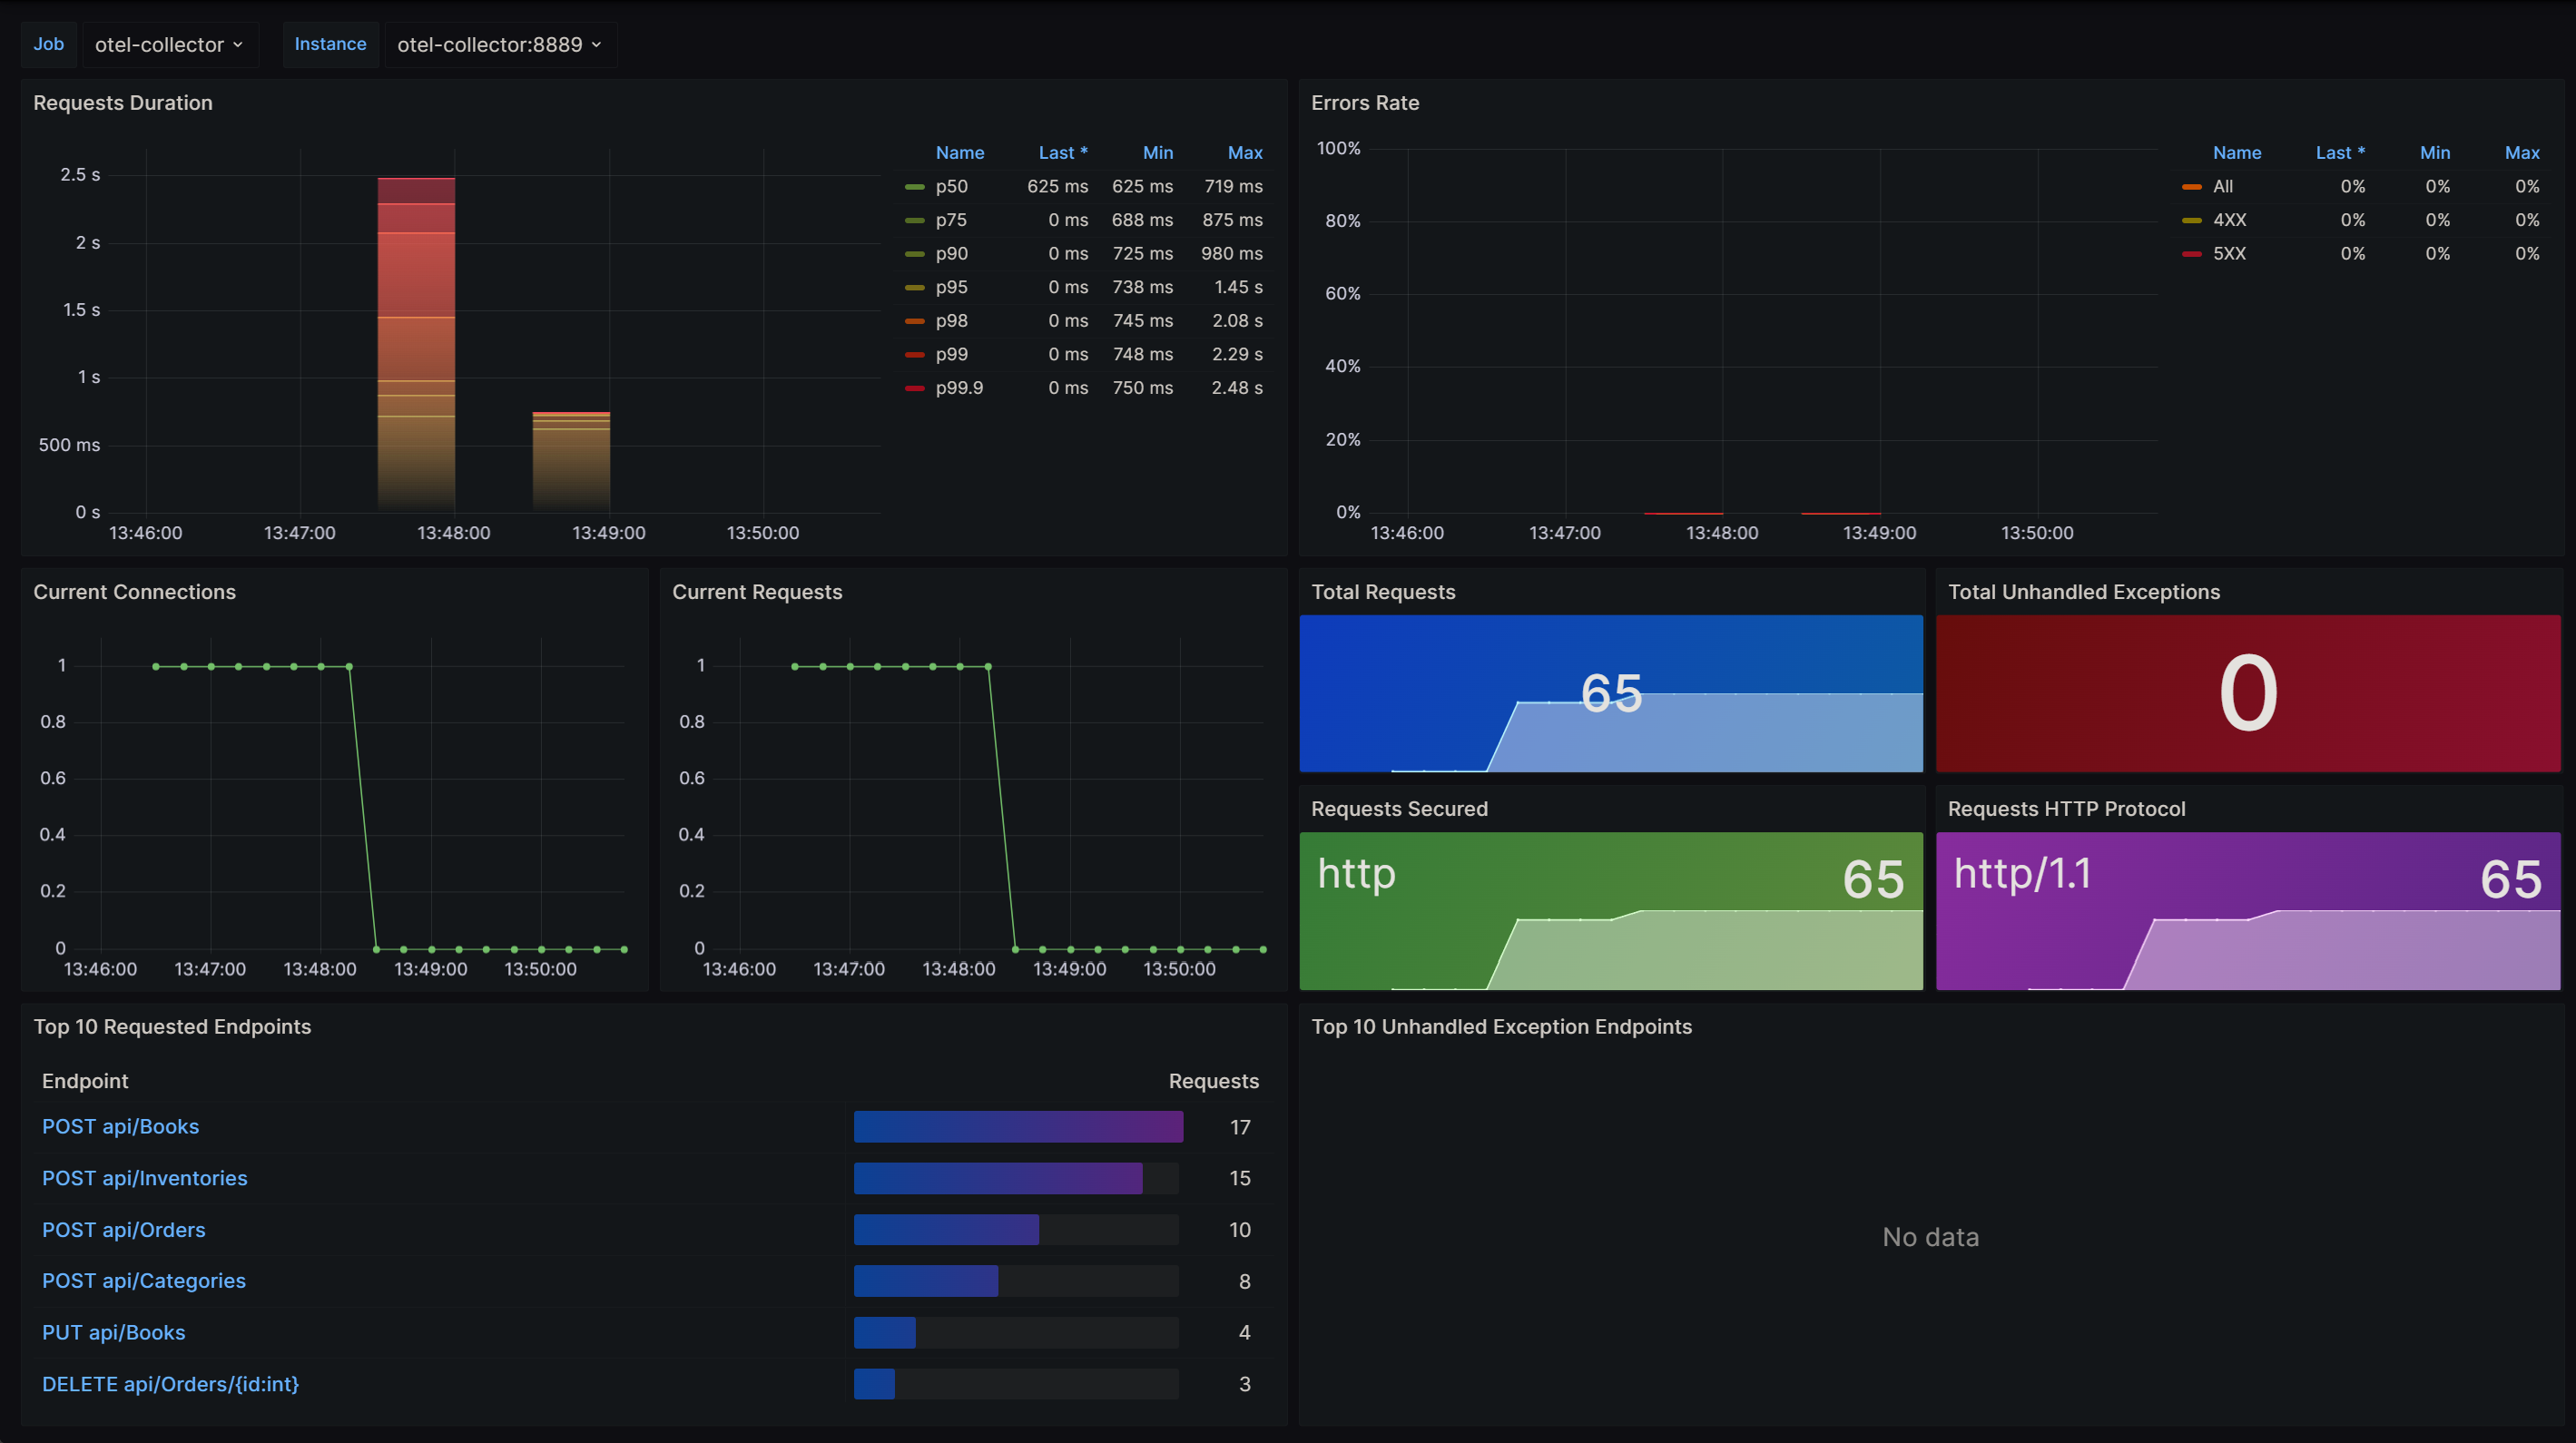
.NET built-in metrics dashboard
This dashboards were not built by me; they were built by the .NET team. I simply imported them into Grafana.
- If you want to play around with them on your own, here is the link.
There are 2 dashboards:
- The first one provides a general overview of our app.
- The second one offers more details for every endpoint available in our app.
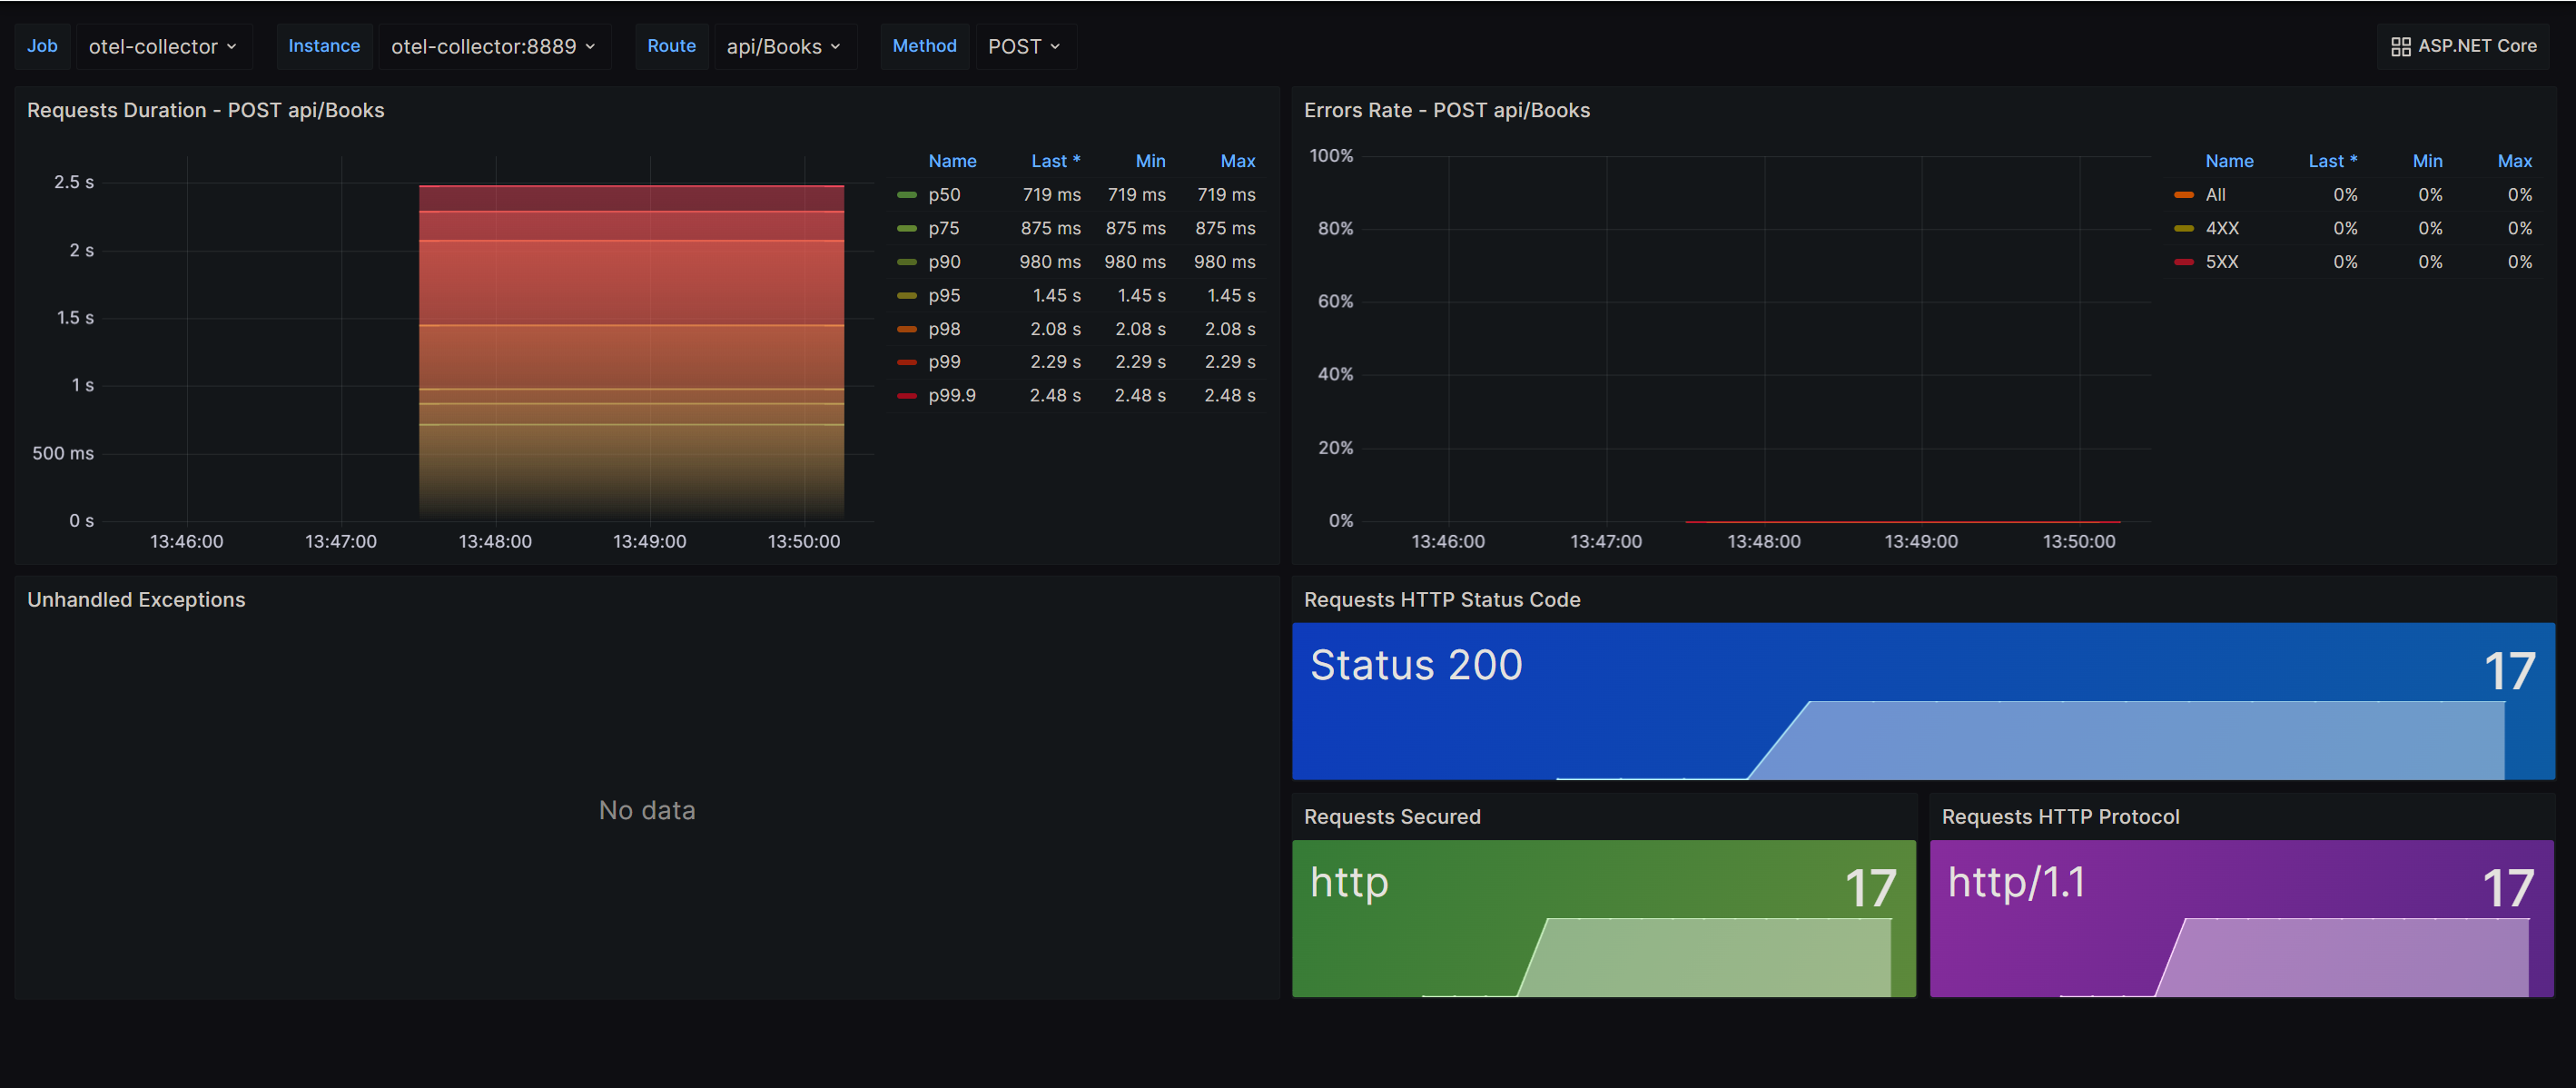
.NET general metrics dashboard
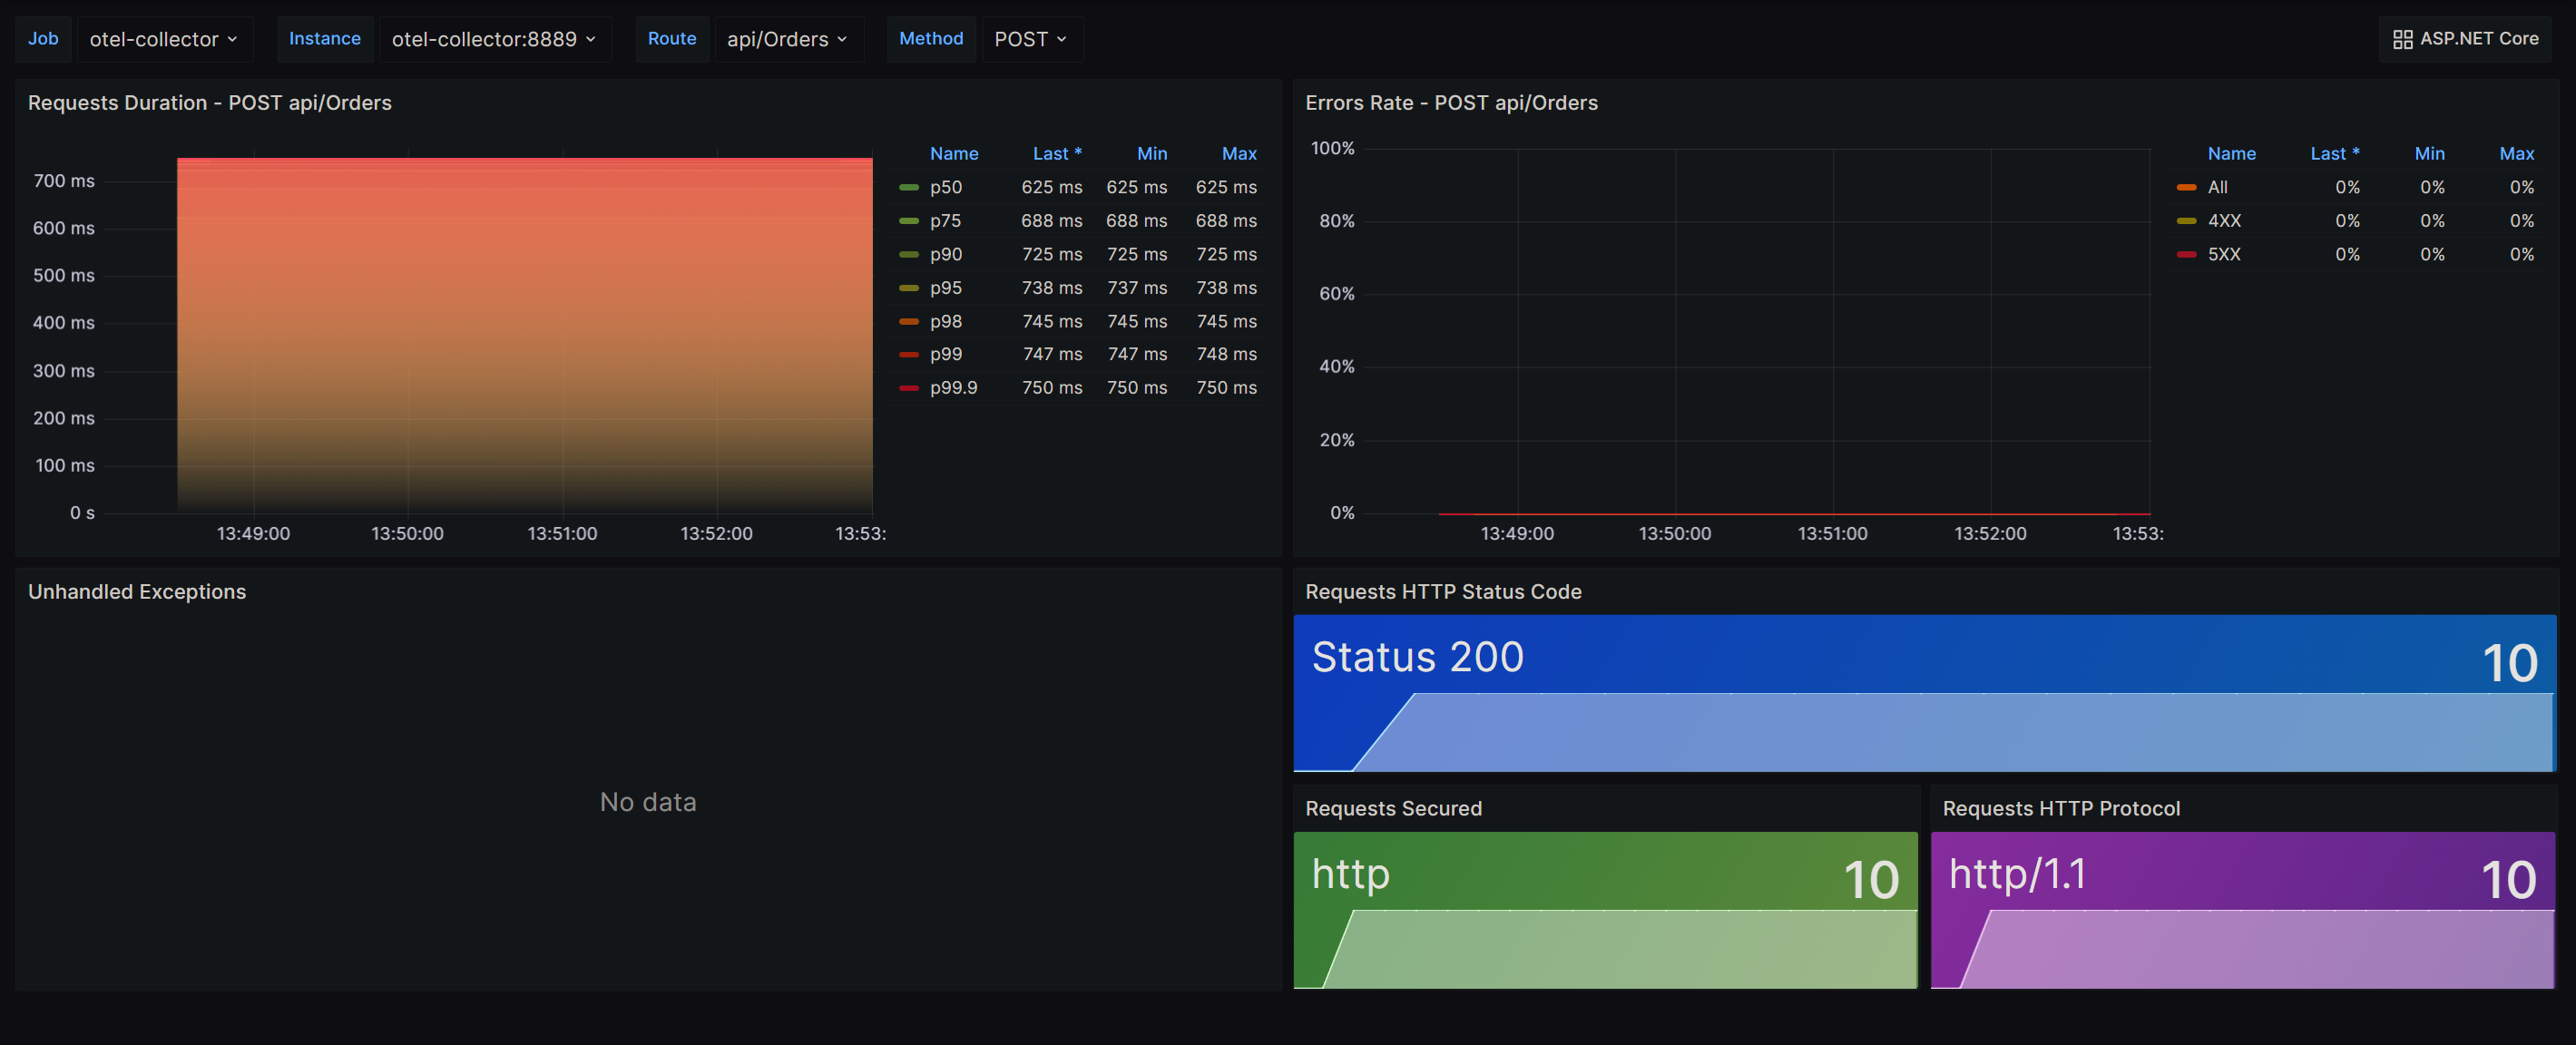
.NET /api/orders endpoint metrics
.NET /api/books endpoint metrics
How to test the BookStore Api
If you want to take a look at the source code, you can go to my GitHub repository.
If you want to execute the BookStore API for yourselves, I have uploaded a docker-compose file that starts up the app and also the external dependencies.
The external dependencies (Prometheus, MSSQL Server, Grafana and OpenTelemetry Collector) are already preconfigured so you don’t need to do any extra setup. Just run docker-compose up and you’re good to go!
Here’s how the docker-compose file looks like:
version: '3.8'

networks:
  metrics:
    name: bookstore-network

services:
  mssql:
    build:
      context: ./scripts/sql
    ports:
      - "1433:1433"
    environment:
      SA_PASSWORD: "P@ssw0rd?"
      ACCEPT_EULA: "Y"
    networks:
      - metrics

  prometheus:
    build:
      context: ./scripts/prometheus
    depends_on:
      - app
    ports:
      - 9090:9090
    networks:
      - metrics

  grafana:
    build:
      context: ./scripts/grafana
    depends_on:
      - prometheus
    ports:
      - 3000:3000
    networks:
      - metrics

  otel-collector:
    image: otel/opentelemetry-collector:0.89.0
    command: ["--config=/etc/otel-collector-config.yaml"]
    volumes:
      - ./scripts/otel-collector/otel-collector-config.yaml:/etc/otel-collector-config.yaml
    ports:
      - "8888:8888"
      - "8889:8889"
      - "13133:13133"
      - "4317:4317"
    networks:
      - metrics

  app:
    build:
      context: ./
      dockerfile: ./src/BookStore.WebApi/Dockerfile
    depends_on:
      - mssql
      - otel-collector
    ports:
      - 5001:8080
    environment:
      ConnectionStrings__DbConnection: Server=mssql;Database=BookStore;User Id=SA;Password=P@ssw0rd?;Encrypt=False
      Otlp__Endpoint: http://otel-collector:4317
    networks:
      - metrics
How to generate metrics to test the Grafana dashboards
In my GitHub repository, you’ll also find a seed-data.sh Shell script. This script will invoke some endpoints of the BookStore API via cURL.
To execute the seed-data.sh, you need to have cURL installed on your local machine.
The seed-data.sh script runs the following actions:
- Add 8 book categories.
- Update 3 book categories.
- Delete 2 book categories.
- Add 17 books into the store.
- Update 4 existing books.
- Delete 2 existing books.
- Add inventory for every book on the store.
- Create 10 orders.
- Cancel 3 existing orders.
The purpose behind this script is to generate a decent amount of business metrics that can later be visualized in Grafana and Prometheus.