Getting started with OpenTelemetry Metrics in .NET 8. Part 1: Key concepts
This is a two-part series post.
- Part 1: Key concepts that you should know when using OpenTelemetry Metrics with .NET.
- Part 2: A practical example of how to add OpenTelemetry Metrics to a real life .NET 8 app and how to visualize those metrics using Prometheus and Grafana. If you want to read it, click here
OpenTelemetry is a set of APIs, SDKs, tooling and integrations that are designed for the creation and management of telemetry data such as traces, metrics, and logs.
In one of my previous posts I talked about how to get started with OpenTelemetry and distributed tracing, now I want to focus on metrics.
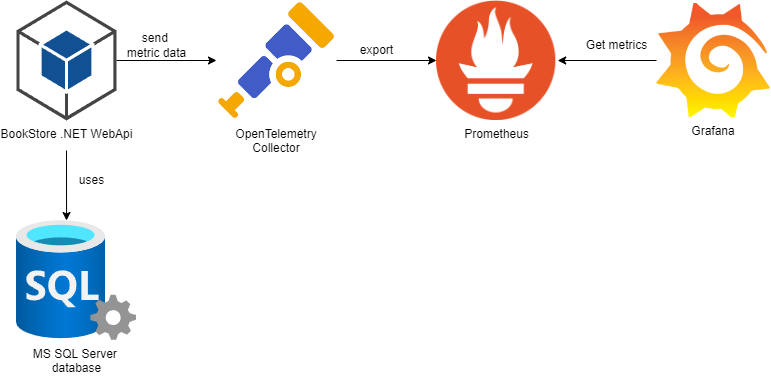
At the end of this two-part series post, we will have a .NET 8 app that emits a series of metrics. These metrics will be sent to an OpenTelemetry Collector, and a Prometheus Server will receive the metrics from the OTEL Collector. Finally, we will have a Grafana dashboard to visualize them.
But before jumping to the practical part there are a few key concepts about using OpenTelemetry Metrics with .NET that are worth talking about.
Metrics API
The Metrics API allows users to capture measurements at runtime. The Metrics API is designed to process raw measurements, generally with the intent to produce continuous summaries of those measurements.
The Metrics API has three main components:
- MeterProvider: The entry point of the API, provides access to Meters.
- Meter: Responsible for creating Instruments.
- Instrument: Responsible for reporting Measurements.
Metrics in OpenTelemetry .NET are a somewhat unique implementation of the OpenTelemetry project, as the Metrics API is incorporated directly into the .NET runtime itself, as part of the System.Diagnostics.DiagnosticSource package. This means, users can instrument their applications and libraries to emit metrics by simply using the System.Diagnostics.DiagnosticSource package.
MeterProvider
OpenTelemetry Metrics works by using the MeterProvider to create a Meter and associating it with one or more Instruments, each of which is used to create a series of Measurements.
The MeterProvider must be configured to collect metrics using the OpenTelemetry .NET SDK, to set it up properly you need to use the .WithMetrics() extension method from the OpenTelemetry.Extensions.Hosting NuGet package.
The MeterProvider will hold all the configuration for metrics like Meter names, readers, etc.
Here’s an example of how to setup the MeterProvider on .NET:
builder.Services.AddOpenTelemetry().WithMetrics(opts => opts
    .SetResourceBuilder(ResourceBuilder.CreateDefault().AddService("BookStore.WebApi"))
    .AddPrometheusExporter());
Calling the AddOpenTelemetry() method before the WithMetrics() is required when working with OpenTelemetry. This method is responsible for registering an IHostedService that starts the tracing and metric services.
All the OpenTelemetry.Extensions.Hosting versions prior to 1.4.0 contained a signal-specific method for configuring metrics:
AddOpenTelemetryTracing()
This method is obsolete and you should migrate to the new AddOpenTelemetry().WithMetrics() method.
Meter, Instruments and Measurements
A Meter is responsible for creating Instruments and it must provide a series of functions to create new Instruments.
Instruments are used to report Measurements.
Measurements are what we create or observe in our applications.
Here is a quick example for a better understading. The next code snippet shows:
- How to create a
Meter. - How to use the
Meterto create anInstrumentof typeCounter. - How to report
Measurementswith it.
public class Program
{
    static Meter meter = new Meter("MyMeter");
    static Counter<int> myCounter = meter.CreateCounter<int>("my-counter");

    static void Main(string[] args)
    {
        while(true)
        {
            myCounter.Add(1);
        }
    }
}
IMeterFactory interface
Before .NET 8, to create a new Meter object, you needed to instantiate an object of the Meter class and pass the meter name, like this:
var meter = new Meter("BookStore");
Starting from .NET 8, the IMeterFactory interface is the recommended way to create a new Meter. It can be used with the DI container and it is registered on it by default, no extra registration is required.
The interface only exposes a single Create() method.
public interface IMeterFactory : IDisposable
{
    /// <summary>
    /// Creates a new <see cref="Meter"/> instance.
    /// </summary>
    /// <param name="options">The <see cref="MeterOptions"/> to use when creating the meter.</param>
    /// <returns>A new <see cref="Meter"/> instance.</returns>
    /// <remarks>
    /// The <see cref="Meter"/> instance returned by this method should be cached by the factory and returned for subsequent requests for a meter with the same parameters (name, version, and tags).
    /// </remarks>
    Meter Create(MeterOptions options);
}
And if we take a peek at the implementation, you’ll see it’s a very straightforward one.
internal sealed class DummyMeterFactory : IMeterFactory
{
    public Meter Create(MeterOptions options) => new Meter(options);

    public void Dispose() { }
}
The next code snippet, shows an example of how to use it. Simply inject the IMeterFactory interface and use it to create the Meter. Afterward use that Meter to create the desired Instruments.
  public BookStoreMetrics(IMeterFactory meterFactory, IConfiguration configuration)
  {
      var meter = meterFactory.Create("BookStore");
      BooksAddedCounter = meter.CreateCounter<int>("books-added", "Book");
  }
Types of Instruments
The OpenTelemetry specification provides 6 types of instruments that we can capture measurements with.
These 6 types of instruments can be grouped into two categories: synchronous and asynchronous.
Counter
A Counter is a synchronous instrument that is always increasing, and only accepts non–negative values.
When using a Counter, an Add operation will be available in the .NET SDK, which must be provided with the non–negative number to increment the Counter by, along with an optional set of attributes to be attached.
Here’s a quick example of how to create and use a Counter instrument:
Counter<int> BooksAddedCounter = meter.CreateCounter<int>("books-added", "Book", "Amount of books");
BooksAddedCounter.Add(1);
books-addedis the name of theCounter.Bookrepresents the unit of measure. The unit of measure is an optional string provided by the author of the instrument.Amount of booksrepresents the instrument description. The description is an optional free-form text provided by the author of the instrument.
Asynchronous Counter
An Asynchronous Counter is an asynchronous instrument which reports monotonically increasing value(s) when the instrument is being observed.
It differs from the Counter by operating via callback rather than the Add function.
When the instrument is observed, the callback is executed and will pass back one or more measurements expressed as absolute values.
Here’s a quick example of how to create and use an Asynchronous Counter instrument (aka ObservableCounter on .NET):
ObservableCounter<int> OrdersCanceledCounter = meter.CreateObservableCounter<int>("orders-canceled", () => GetOrdersCanceled(), "Order", "Amount of orders cancelled");
orders-canceledis the name of theCounter.() => GetOrdersCanceled()is the callback function responsible for reportingMeasurements.Orderrepresents the unit of measure. The unit of measure is an optional string provided by the author of the instrument.Amount of orders cancelledrepresents the instrument description. The description is an optional free-form text provided by the author of the instrument.
Histogram
A Histogram is a synchronous instrument which allows the recording of multiple values that are statistically relevant to each other.
You would choose a Histogram when you don’t want to analyze data points in isolation, but would rather generate statistical information about their distribution by tracking the number of values that fall in each predefined bucket, as well as the minimum and the maximum value.
Histograms have a single method that is exposed: Record. Record takes a non–negative observation value and an optional set of attributes to be attached.
Here’s a quick example of how to create and use an Histogram instrument:
 Histogram<int> NumberOfBooksPerOrderHistogram = meter.CreateHistogram<int>("orders-number-of-books", "Book", "Number of books per order");
 NumberOfBooksPerOrderHistogram.Record(amount);
orders-number-of-booksis the name of theHistogram.Bookrepresents the unit of measure. The unit of measure is an optional string provided by the author of the instrument.Number of books per orderrepresents the instrument description. The description is an optional free-form text provided by the author of the instrument.
Asynchronous Gauge
An Asynchronous Gauge is designed to represent values that do not make sense to sum, even if they share attribute data.
An example of this would be the temperature in various rooms of a house. This is common data, but it does not make any sense to report it as a total value—you’d potentially want an average or maximum, but never a sum.
In the same manner, as all asynchronous instruments, a callback is passed when creating an Asynchronous Gauge, which can return one or more measurements.
Here’s a quick example of how to create and use an Asynchronous Gauge instrument (aka ObservableGauge on .NET):
ObservableGauge<int> TotalCategoriesGauge = meter.CreateObservableGauge<int>("total-categories", () => GetTotalCategories(), "Category", "Get total amount of categories");
total-categoriesis the name of theGauge.() => GetTotalCategories()is the callback function responsible for reportingMeasurements.Categoryrepresents the unit of measure. The unit of measure is an optional string provided by the author of the instrument.Get total amount of categoriesrepresents the instrument description. The description is an optional free-form text provided by the author of the instrument.
Up Down Counter
An UpDownCounter is a similar synchronous instrument to a Counter, but it allows negative delta values to be passed.
Where a Counter would be suited to represent the number of jobs that had been submitted, a UpDownCounter would be perfect to represent the current number of active jobs being processed (the current value can move up and down).
An UpDownCounter presents an Add operation that is identical to the Counter operation—with the exception that it accepts negative data values.
Here’s a quick example of how to create and use a UpDownCounter instrument:
UpDownCounter<int> TotalBooksUpDownCounter = meter.CreateUpDownCounter<int>("total-books", "Book", "Total books available in the shop");
TotalBooksUpDownCounter.Add(1);
TotalBooksUpDownCounter.Add(-1);
total-booksis the name of theUpDownCounter.Bookrepresents the unit of measure. The unit of measure is an optional string provided by the author of the instrument.Total books available in the shoprepresents the instrument description. The description is an optional free-form text provided by the author of the instrument.
Asynchronous Up Down Counter
Asynchronous UpDownCounter is an asynchronous instrument which reports additive value when the instrument is being observed.
It provides a callback interface that returns one or more measurements, expressing each measurement as an absolute value which will be changed to a delta value internally.
Here’s a quick example of how to create and use an Asynchronous UpDownCounter instrument (aka ObservableUpDownCounter on .NET):
ObservableUpDownCounter<int> TotalCategoriesUpDownCounter = meter.CreateObservableUpDownCounter<int>("total-categories", () => GetTotalCategories(), "Category", "Get total amount of categories");
total-categoriesis the name of theUpDownCounter.() => GetTotalCategories()is the callback function responsible for reportingMeasurements.Categoryrepresents the unit of measure. The unit of measure is an optional string provided by the author of the instrument.Get total amount of categoriesrepresents the instrument description. The description is an optional free-form text provided by the author of the instrument.
Types of Instruments available on .NET
In the above section we have seen the different types of instruments available in the OpenTelemetry specification, .NET has support for all of them.
Keep in mind that the
UpDownCounterand theAsynchronous UpDownCounterinstruments are only available starting from .NET 7.
Choosing the correct instrument
Choosing the correct instrument to report measurements is critical to achieving better efficiency, easing consumption for the user, and maintaining clarity in the semantics of the metric stream.
I want to count something
- If the value is monotonically increasing (the delta value is always non-negative), use a
Counter - If the value is NOT monotonically increasing (the delta value can be positive, negative or zero), use an
UpDownCounter.
I want to record or time something
- If you expect that the collected statistics are meaningful, use a
Histogram
I want to measure something
- If it makes NO sense to add up the values across different sets of attributes, use an
Asynchronous Gauge. - If it makes sense to add up the values across different sets of attributes and the value is monotonically increasing, use an
Asynchronous Counter. - If it makes sense to add up the values across different sets of attributes and the value is NOT monotonically increasing, use an
Asynchronous UpDownCounter.
.NET built-in metrics
Starting from .NET 8, the .NET framework itself has some built-in metrics.
These metrics are generated by the System.Diagnostics.Metrics API. You can see a full list in the following link:
For now, it’s enough for you to know that the .NET framework itself is instrumented to generate a series of metrics, and we can listen to them and send them wherever we consider appropriate for their analysis.
In the second part of the post, we will explore in detail the various options we have for emitting and exporting these metrics.
Exporters
Let’s be honest emiting metrics is kind of pointless if you don’t have a backend capable of aggregating the metrics and displaying them in a friendly manner.
There are 2 ways to exporting data on OpenTelemetry:
- Using the OpenTelemetry Collector.
- Exporting the data directly into a back-end (like Prometheus, Jaeger, Zipkin, Elastic APM, Azure Monitor, etc).
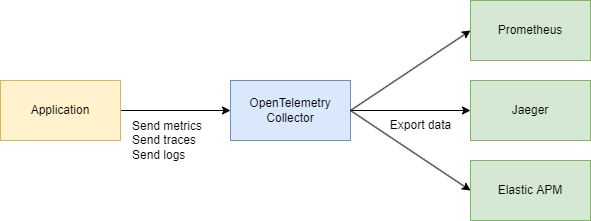
Using the OpenTelemetry Collector
The OpenTelemetry Collector is a standalone process designed to receive, process and export telemetry data.
It removes the need to run, operate and maintain multiple agents/collectors in order to support open-source telemetry data formats (e.g. Jaeger, Prometheus, Zipkin, etc.) sending to multiple open-source or commercial back-ends.
It eases the integration with your apps because you only need to export your data to a single endpoint, the collector endpoint, using the OTLP protocol.
To send metrics to the OpenTelemetry Collector in .NET, you’ll need to install the OpenTelemetry.Exporter.OpenTelemetryProtocol NuGet package on your application and configure the MeterProvider using the AddOtlpExporter extension method, like this:
builder.Services.AddOpenTelemetry().WithMetrics(opts => opts
    .SetResourceBuilder(ResourceBuilder.CreateDefault().AddService("BookStore.WebApi"))
    .AddMeter(builder.Configuration.GetValue<string>("BookStoreMeterName"))
    .AddOtlpExporter(opts =>
    {
        opts.Endpoint = new Uri(builder.Configuration["Otlp:Endpoint"]);
    }));
Exporting the data directly into a backend
You can export the metrics directly to a backend using the OpenTelemetry.Exporter.* NuGet packages
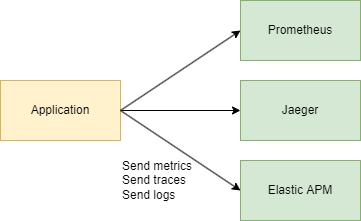
Here’s an example of how to send the metrics data directly to Prometheus using the OpenTelemetry.Exporter.Prometheus.AspNetCore NuGet package:
builder.Services.AddOpenTelemetry().WithMetrics(opts => opts
    .SetResourceBuilder(ResourceBuilder.CreateDefault().AddService("BookStore.WebApi"))
    .AddMeter(builder.Configuration.GetValue<string>("BookStoreMeterName"))
    .AddPrometheusExporter());
When to use the OpenTelemetry Collector
Under what circumstances does one use a collector to send data, as opposed to having each service send it directly to the backend?
For trying out and getting started with OpenTelemetry, sending your data directly to a backend is a great way to get value quickly. Also, in a development or small-scale environment you can get decent results without a collector.
However, in general it’s recommended to use the collector alongside your service, since it allows your service to offload data quickly and the collector can take care of additional handling like retries, batching, encryption or even sensitive data filtering.
Also using the collector eases the integration with your apps because you only need to export data to a single service using the OTLP protocol.
If you send the data directly to a backend, you probably will end up with multiples configurations: a configuration to export the application traces into Jaeger or Zipkin, or whatever. Another configuration to export the metrics, another for logs, and so forth and so on.