Getting started with OpenTelemetry and distributed tracing in .NET
Just show me the code
As always, if you don’t care about the post I have upload the source code on my Github
This post was written over a year and a half ago, and since then, there have been several updates to the OpenTelemetry .NET SDK. Additionally, a new version of the .NET framework has been released. It’s time to update this post to reflect the current state of OpenTelemetry.
OpenTelemetry is a collection of APIs, SDKs, tools, and integrations designed for the creation and management of telemetry data, such as traces, metrics, and logs. This post will focus exclusively on tracing. From my perspective, there are at least four main concepts about tracing and OpenTelemetry that you need to understand.
Span and Activities
A span is the building block that forms a trace, it has a unique identifier and represents a piece of the workflow in the distributed system.
Multiple spans are pieced together to create a trace. Traces are often viewed as a “tree” of spans that reflects the time that each span started and completed.
In .NET a span is represented by an Activity.
The OpenTelemetry client for dotnet is reusing the existing Activity and associated classes to represent the OpenTelemetry Span.
This means that users can instrument their applications/libraries to emit OpenTelemetry compatible traces by using just the .NET Runtime.
To create a Span in .NET we must first create a new activity:
private static readonly ActivitySource Activity = new(nameof(RabbitRepository));
And then call “StartActivity” to begin recording, everything that happens inside the using block will be recorded into that Span.
using (var activity = Activity.StartActivity("Process Message", ActivityKind.Consumer, parentContext.ActivityContext)){}
Propagators
A propagator allows us to extract and inject context across process boundaries.
This is typically required if you are not using any of the .NET communication libraries which has instrumentations already available which does the propagation (eg: HttpClient).
In such cases, context extraction and propagation is the responsibility of the library itself.
To create a propagator in .NET we must first create a TextMapPropagator
private static readonly TextMapPropagator Propagator = new TraceContextPropagator();
Then use the Inject and Extract methods for inter-process trace propagation.
The “Inject” method injects the Activity into a carrier. For example, into the headers of an HTTP request.
Propagator.Inject(new PropagationContext(activity.Context, Baggage.Current), props, InjectContextIntoHeader);
And the “Extract” method extracts the value from an incoming request. For example, from the headers of an HTTP request.
If a value can not be parsed from the carrier, for a cross-cutting concern, the implementation should not throw an exception and should not store a new value in the Context, in order to preserve any previously existing valid value.
var parentContext = Propagator.Extract(default, ea.BasicProperties, ExtractTraceContextFromBasicProperties);
Exporters
Let’s be honest, emitting metrics is somewhat pointless if you don’t have a backend capable of aggregating these metrics and presenting them in a user-friendly manner.
There are two methods for exporting data on OpenTelemetry:
- Utilizing the OpenTelemetry Collector.
- Directly exporting the data into a backend (such as Prometheus, Jaeger, Zipkin, Elastic APM, Azure Monitor, etc).
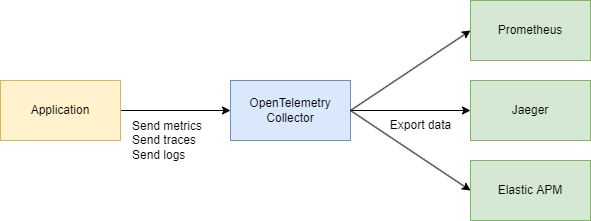
Using the OpenTelemetry Collector
The OpenTelemetry Collector is a standalone process designed to receive, process and export telemetry data.
It removes the need to run, operate and maintain multiple agents/collectors in order to support open-source telemetry data formats (e.g. Jaeger, Prometheus, Zipkin, etc.) sending to multiple open-source or commercial back-ends.
It eases the integration with your apps because you only need to export your data to a single endpoint, the collector endpoint, using the OTLP protocol.
Exporting the data directly into a backend
You can export traces, metrics and logs directly to a backend using the OpenTelemetry.Exporter.* NuGet packages.
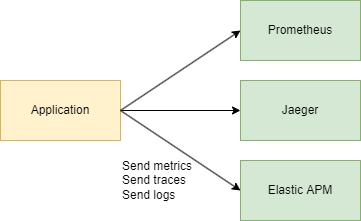
In this post, we’re going to export traces directly to Jaeger using the
OpenTelemetry.Exporter.OpenTelemetryProtocolNuGet package.
Attributes
Attributes are key:value pairs that provide additional information to a trace.
In .NET those are called Tags. We can add an attribute into an Activity like this:
  activity?.SetTag("messaging.system", "rabbitmq");
  activity?.SetTag("messaging.destination_kind", "queue");
  activity?.SetTag("messaging.rabbitmq.queue", "sample");
I’m going to stop discussing OpenTelemetry theory because I could end up writing an entire post about it.
And to be honest, I would essentially be paraphrasing the official documentation. So, instead of that, I’ll direct you to the official documentation: https://opentelemetry.io/docs/concepts/
After a brief discussion on OpenTelemetry, let’s redirect our attention to the primary objective of this post: To offer a practical example of how to begin using OpenTelemetry when you have a series of .NET services interacting with each other.
Demo
I have previously constructed four applications. These applications do not execute any business logic operations, as that’s not the focus here.
The critical aspect is that all the applications communicate with each other and also interact with other external services such as Redis, MSSQL, or RabbitMQ.
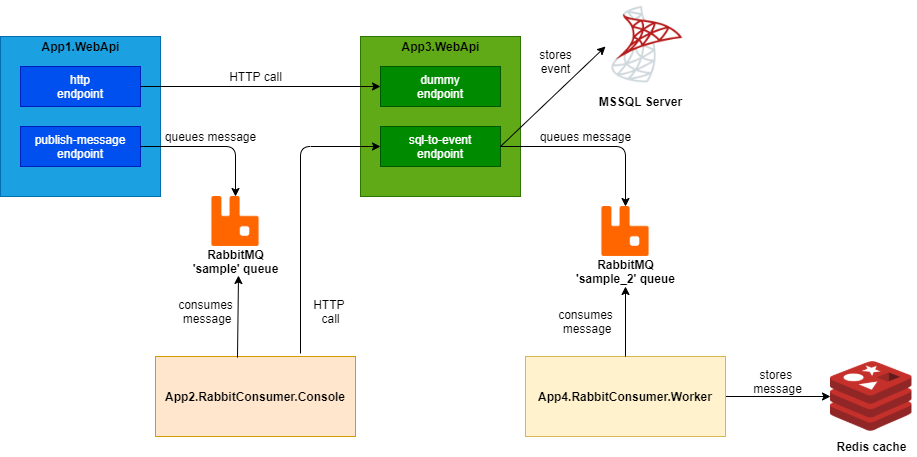
Here’s the diagram:
-
App1.WebApi is a .NET 8 API with 2 endpoints.
- The /http endpoint makes an HTTP request to the App2 "/dummy" endpoint.
- The /publish-message endpoint queues a message into a Rabbit queue named “sample”.
-
App2.RabbitConsumer.Console is a .NET 8 Console application.
- It dequeues messages from the Rabbit “sample” queue and makes an HTTP request to the App3 "/sql-to-event" endpoint with the content of the message.
-
App3.WebApi is a .NET 8 Minimal API with 2 endpoints
- The /dummy endpoint returns a fixed “Ok” response.
- The /sql-to-event endpoint receives a message via HTTP POST, stores it in a MSSQL Server, and afterwards publishes the message as an event into a RabbitMq queue named “sample_2”.
-
App4.RabbitConsumer.HostedService is a .NET 8 Worker Service.
- A Hosted Service reads the messages from the Rabbitmq “sample_2” queue and stores them into a Redis cache database.
These applications are not currently utilizing OpenTelemetry. Therefore, in the following sections, we will provide a step-by-step guide on how to set up and use the OpenTelemetry client.
OpenTelemetry .NET Client
To get started with OpenTelemetry we’re going to need the following packages.
  <PackageReference Include="OpenTelemetry" Version="1.8.0" />
  <PackageReference Include="OpenTelemetry.Instrumentation.AspNetCore" Version="1.8.1" />
  <PackageReference Include="OpenTelemetry.Exporter.OpenTelemetryProtocol" Version="1.8.0" />
  <PackageReference Include="OpenTelemetry.Extensions.Hosting" Version="1.8.0" />
  <PackageReference Include="OpenTelemetry.Instrumentation.Http" Version="1.8.1" />
  <PackageReference Include="OpenTelemetry.Instrumentation.SqlClient" Version="1.8.0-beta.1" />
  <PackageReference Include="ZiggyCreatures.FusionCache.OpenTelemetry" Version="1.0.0" />
- The OpenTelemetry package is the core library.
- The OpenTelemetry.Exporter.OpenTelemetryProtocol package enables us to send traces to a compatible OTLP endpoint. For this demo, the traces will be send to Jaeger.
- In previous versions of OpenTelemetry, the NuGet package
OpenTelemetry.Exporter.Jaegerwas used to send traces to Jaeger. This package is now deprecated in favor ofOpenTelemetry.Exporter.OpenTelemetryProtocol.
- In previous versions of OpenTelemetry, the NuGet package
- The OpenTelemetry.Extensions.Hosting package contains extensions that allows us to configure the TraceProvider.
- The OpenTelemetry.Instrumentation.* packages are instrumentation libraries. These packages instrument common libraries, functionalities, and classes, reducing the need for manual implementation. In our demo, we’re using the following ones:
- The OpenTelemetry.Instrumentation.AspNetCore instruments ASP.NET Core and collects telemetry about incoming web requests. This instrumentation also collects incoming gRPC requests using Grpc.AspNetCore.
- The OpenTelemetry.Instrumentation.Http instruments the System.Net.Http.HttpClient and System.Net.HttpWebRequest types and collects telemetry about outgoing HTTP requests.
- The OpenTelemetry.Instrumentation.SqlClient instruments the Microsoft.Data.SqlClient and System.Data.SqlClient types and collects telemetry about database operations.
- To interact with Redis, we’re going to use the FusionCache library. It is an easy-to-use library with quite a few advanced features. To instrument the FusionCache library, we’re using the
ZiggyCreatures.FusionCache.OpenTelemetrylibrary. This library collects telemetry about outgoing calls to the cache.
In the near future, I anticipate seeing more and more instrumentation libraries like these. This will allow us to effortlessly instrument the most commonly used dependencies. Simply install a NuGet package, add some configuration lines to your app, and you’re all set.
Adding OpenTelemetry on App1
1. Setup the OpenTelemetry library
services.AddOpenTelemetry().WithTracing(builder =>
{
    builder.AddAspNetCoreInstrumentation()
        .AddHttpClientInstrumentation()
        .AddSource(nameof(PublishMessageController))
        .SetResourceBuilder(ResourceBuilder.CreateDefault().AddService("App1"))
        .AddOtlpExporter(opts =>
        {
            opts.Endpoint =
                new Uri($"{Config["Jaeger:Protocol"]}://{Config["Jaeger:Host"]}:{Config["Jaeger:Port"]}");
        });
});
This is the first app we’re instrumenting, so I’ll explain what we’re doing line by line.
AddAspNetCoreInstrumentation()
This enables .NET Core instrumentation.
AddHttpClientInstrumentation()
This enables HTTP Instrumentation. App1 makes an HTTP request to App2. If we want to trace the HTTP call between these two apps, we can do it simply by adding this extension method.
.AddSource(nameof(PublishMessageController))
The AddSource method can be used to add an ActivitySource to the provider. Multiple AddSource methods can be called to add more than one span.
Why do we need this? App1 queues a message into a rabbit queue and we want to record this trace.
OpenTelemetry has many instrumentation libraries, but none are available for RabbitMQ. To create a distributed transaction between two applications that communicate using RabbitMQ, we must implement it ourselves, using an Activity.
SetResourceBuilder(ResourceBuilder.CreateDefault().AddService("App1"))
A Resource is the immutable representation of the entity producing the telemetry.
With the SetResourceBuilder method, we’re configuring the Resource for the application.
AddOtlpExporter(opts =>
{
    opts.Endpoint =
        new Uri($"{Config["Jaeger:Protocol"]}://{Config["Jaeger:Host"]}:{Config["Jaeger:Port"]}");
});
This method is used to specify the endpoint to which the traces will be sent. Every trace in this demo will be transmitted directly to a Jaeger instance.
2. Instrument dependency calls
Unlike the HTTP request, OpenTelemetry does not yet have support for automatic RabbitMq trace correlation.
The code below demonstrates how the “publish message” trace can be created. The code snippet adds the trace information to the enqueued message header, which will later be used to link both operations.
Specifically, we are using a Propagator to inject the activity into the message header that is going to be queued to Rabbit. Subsequently, the consumer application will use another Propagator to extract the Activity and link the producer activity with the consumer activity.
We are also using the Tags attribute to store relevant metadata into the Activity.
[ApiController]
[Route("publish-message")]
public class PublishMessageController(
    ILogger<PublishMessageController> logger,
    IConfiguration configuration)
    : ControllerBase
{
    private static readonly ActivitySource Activity = new(nameof(PublishMessageController));
    private static readonly TextMapPropagator Propagator = Propagators.DefaultTextMapPropagator;

    [HttpGet]
    public void Get()
    {
        try
        {
            using (var activity = Activity.StartActivity("RabbitMq Publish", ActivityKind.Producer))
            {
                var factory = new ConnectionFactory { HostName = configuration["RabbitMq:Host"] };
                using (var connection = factory.CreateConnection())
                using (var channel = connection.CreateModel())
                {
                    var props = channel.CreateBasicProperties();

                    AddActivityToHeader(activity, props);

                    channel.QueueDeclare(queue: "sample",
                        durable: false,
                        exclusive: false,
                        autoDelete: false,
                        arguments: null);

                    var body = Encoding.UTF8.GetBytes("I am app1");

                    logger.LogInformation("Publishing message to queue");

                    channel.BasicPublish(exchange: "",
                        routingKey: "sample",
                        basicProperties: props,
                        body: body);
                }
            }
        }
        catch (Exception e)
        {
            logger.LogError(e, "Error trying to publish a message");
            throw;
        }
    }

    private void AddActivityToHeader(Activity activity, IBasicProperties props)
    {
        Propagator.Inject(new PropagationContext(activity.Context, Baggage.Current), props, InjectContextIntoHeader);
        activity?.SetTag("messaging.system", "rabbitmq");
        activity?.SetTag("messaging.destination_kind", "queue");
        activity?.SetTag("messaging.rabbitmq.queue", "sample");
    }

    private void InjectContextIntoHeader(IBasicProperties props, string key, string value)
    {
        try
        {
            props.Headers ??= new Dictionary<string, object>();
            props.Headers[key] = value;
        }
        catch (Exception ex)
        {
            logger.LogError(ex, "Failed to inject trace context.");
        }
    }
}
Adding OpenTelemetry on App2
1. Set up the OpenTelemetry library
App2 is a console app, so we have to set up the library in a different way. IInstead of using an IServiceCollection extension, we’re directly creating a TraceProvider. Apart from that, the setup looks pretty much the same.
Sdk.CreateTracerProviderBuilder()
  .AddHttpClientInstrumentation()
  .SetResourceBuilder(ResourceBuilder.CreateDefault().AddService("App2"))
  .AddSource(nameof(Program))
  .AddOtlpExporter(opts =>
  {
      opts.Endpoint =
          new Uri($"{_config["Jaeger:Protocol"]}://{_config["Jaeger:Host"]}:{_config["Jaeger:Port"]}");
  })
  .Build();
2. Instrument dependency calls
The HTTP call is being instrumented automatically thanks to the AddHttpClientInstrumentation extension method, but this app also dequeues a message from Rabbit, so we want to instrument that part.
The code is pretty much the same as the one we have created for the Rabbit producer on App1, the only difference is that instead of injecting the activity we are to extracting it from the message header.
private static async Task ProcessMessage(BasicDeliverEventArgs ea,
            HttpClient httpClient,
            IModel rabbitMqChannel)
{
    try
    {
      //Extract the activity and set it into the current one
      var parentContext = Propagator.Extract(default, ea.BasicProperties, ExtractTraceContextFromBasicProperties);
      Baggage.Current = parentContext.Baggage;

      //Start a new Activity
      using (var activity = Activity.StartActivity("Process Message", ActivityKind.Consumer, parentContext.ActivityContext))
      {

          var body = ea.Body.ToArray();
          var message = Encoding.UTF8.GetString(body);

          //Add Tags to the Activity
          AddActivityTags(activity);

          _logger.LogInformation("Message Received: " + message);

          _ = await httpClient.PostAsync("/sql-to-event",
              new StringContent(JsonSerializer.Serialize(message),
                  Encoding.UTF8,
                  "application/json"));

          rabbitMqChannel.BasicAck(deliveryTag: ea.DeliveryTag, multiple: false);
      }

    }
    catch (Exception ex)
    {
        _logger.LogError($"There was an error processing the message: {ex} ");
    }
}

//Extract the Activity from the message header
private static IEnumerable<string> ExtractTraceContextFromBasicProperties(IBasicProperties props, string key)
{
    try
    {
        if (props.Headers.TryGetValue(key, out var value))
        {
            var bytes = value as byte[];
            return new[] { Encoding.UTF8.GetString(bytes) };
        }
    }
    catch (Exception ex)
    {
        _logger.LogError($"Failed to extract trace context: {ex}");
    }

    return Enumerable.Empty<string>();
}

//Add Tags to the Activity
private static void AddActivityTags(Activity activity)
{
    activity?.SetTag("messaging.system", "rabbitmq");
    activity?.SetTag("messaging.destination_kind", "queue");
    activity?.SetTag("messaging.rabbitmq.queue", "sample");
}
Adding OpenTelemetry on App3
1. Setup the OpenTelemetry library
services.AddOpenTelemetry().WithTracing(builder =>
{
    builder.AddAspNetCoreInstrumentation()
        .AddSource(nameof(RabbitRepository))
        .AddSqlClientInstrumentation()
        .SetResourceBuilder(ResourceBuilder.CreateDefault().AddService("App3"))
        .AddOtlpExporter(opts =>
        {
            opts.Endpoint =
                new Uri($"{Config["Jaeger:Protocol"]}://{Config["Jaeger:Host"]}:{Config["Jaeger:Port"]}");
        });
});
The setup looks almost identical to those on App1 and App2. However, there is one notable difference:
AddSqlClientInstrumentation()
This application does not make any HTTP requests. Instead, it queries a database. Therefore, we’re using the SQL extension method to enable SQL instrumentation. We’re essentially replacing the OpenTelemetry.Instrumentation.Http library with the OpenTelemetry.Instrumentation.SqlClient library.
This application also enqueues a message into a RabbitMQ queue, but the code is exactly the same as the one I have shown you in the App1 section.
Adding OpenTelemetry on App4
1. Setup the OpenTelemetry library
builder.Services.AddFusionCache()
    .WithSerializer(new FusionCacheSystemTextJsonSerializer())
    .WithBackplane(
        new RedisBackplane(new RedisBackplaneOptions { Configuration = $"{builder.Configuration["Redis:Host"]}:{builder.Configuration["Redis:Port"]}" })
    );

builder.Services.AddOpenTelemetry().WithTracing(b =>
{
    b.AddAspNetCoreInstrumentation()
        .AddHttpClientInstrumentation()
        .AddFusionCacheInstrumentation()
        .AddSource(nameof(Worker))
        .SetResourceBuilder(ResourceBuilder.CreateDefault().AddService("App4"))
        .AddOtlpExporter(opts =>
        {
            opts.Endpoint =
                new Uri(
                    $"{builder.Configuration["Jaeger:Protocol"]}://{builder.Configuration["Jaeger:Host"]}:{builder.Configuration["Jaeger:Port"]}");
        });
});
This application dequeues a message from a RabbitMQ queue and stores the message content in a Redis cache database.
The instrumentation for dequeuing the message from RabbitMQ is identical to the snippet I provided in the App2 section, so I won’t repeat that here.
To start using OpenTelemetry with FusionCache, we simply need to utilize the AddFusionCacheInstrumentation method from the ZiggyCreatures.FusionCache.OpenTelemetry NuGet package when configuring the TraceProvider.
Also, before setting up OpenTelemetry, we need to configure FusionCache to use Redis as a backplane.
Jaeger
After integrating the OpenTelemetry library into these four applications, we will generate some traffic and then access Jaeger to start analyzing the traces that the applications are sending.
If we examine an entire trace, here is how it appears:
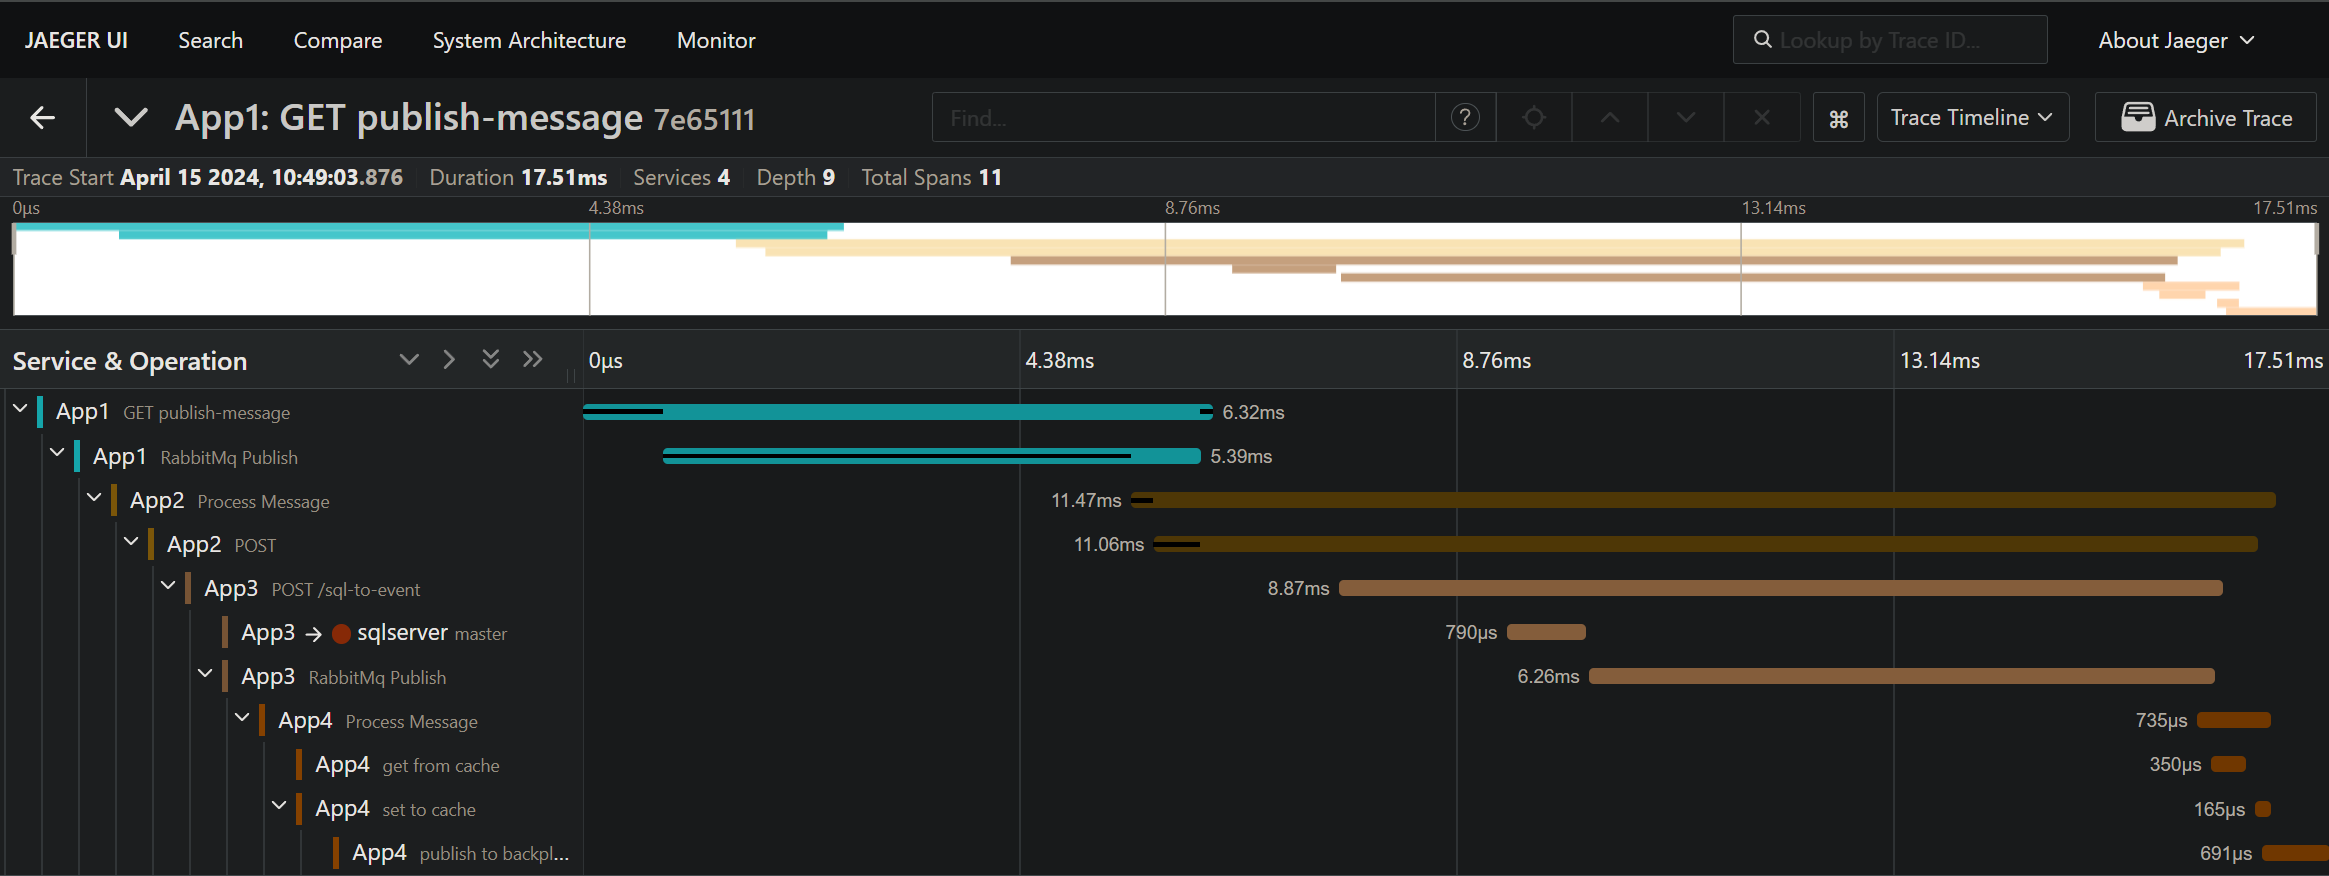
Let me simplify it a bit for you. That’s a magnified image of the spans we have created in our trace.
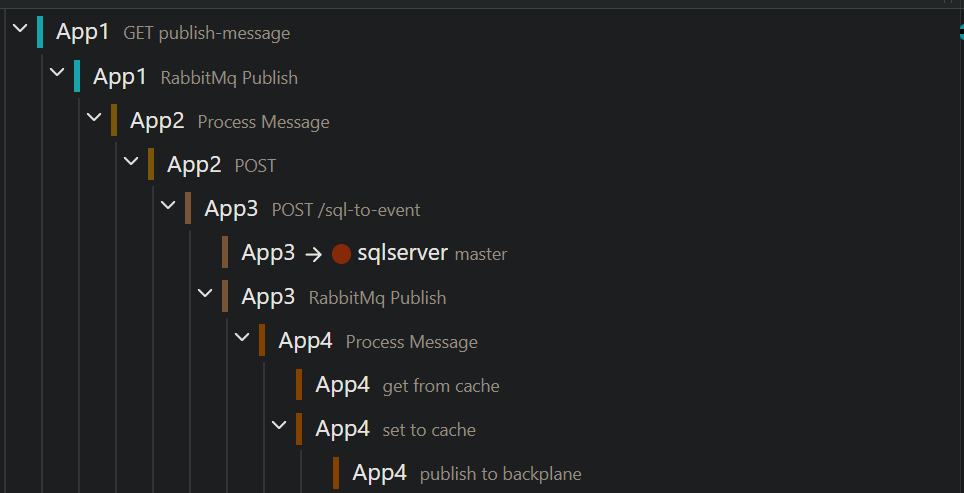
-
The first span (publish-message) corresponds to the App1 API endpoint. This span is automatically created when the API controller is executed, thanks to the
AddAspNetCoreInstrumentation()extension method. -
The second span (RabbitMq publish) is an Activity that we have manually created in App1. You can see the code snippet on the “Adding OpenTelemetry on App1” section.
-
The third span (Process Message) is an Activity that we have manually created in App2. You can also see the code snippet in the “Adding OpenTelemetry on App2” section.
-
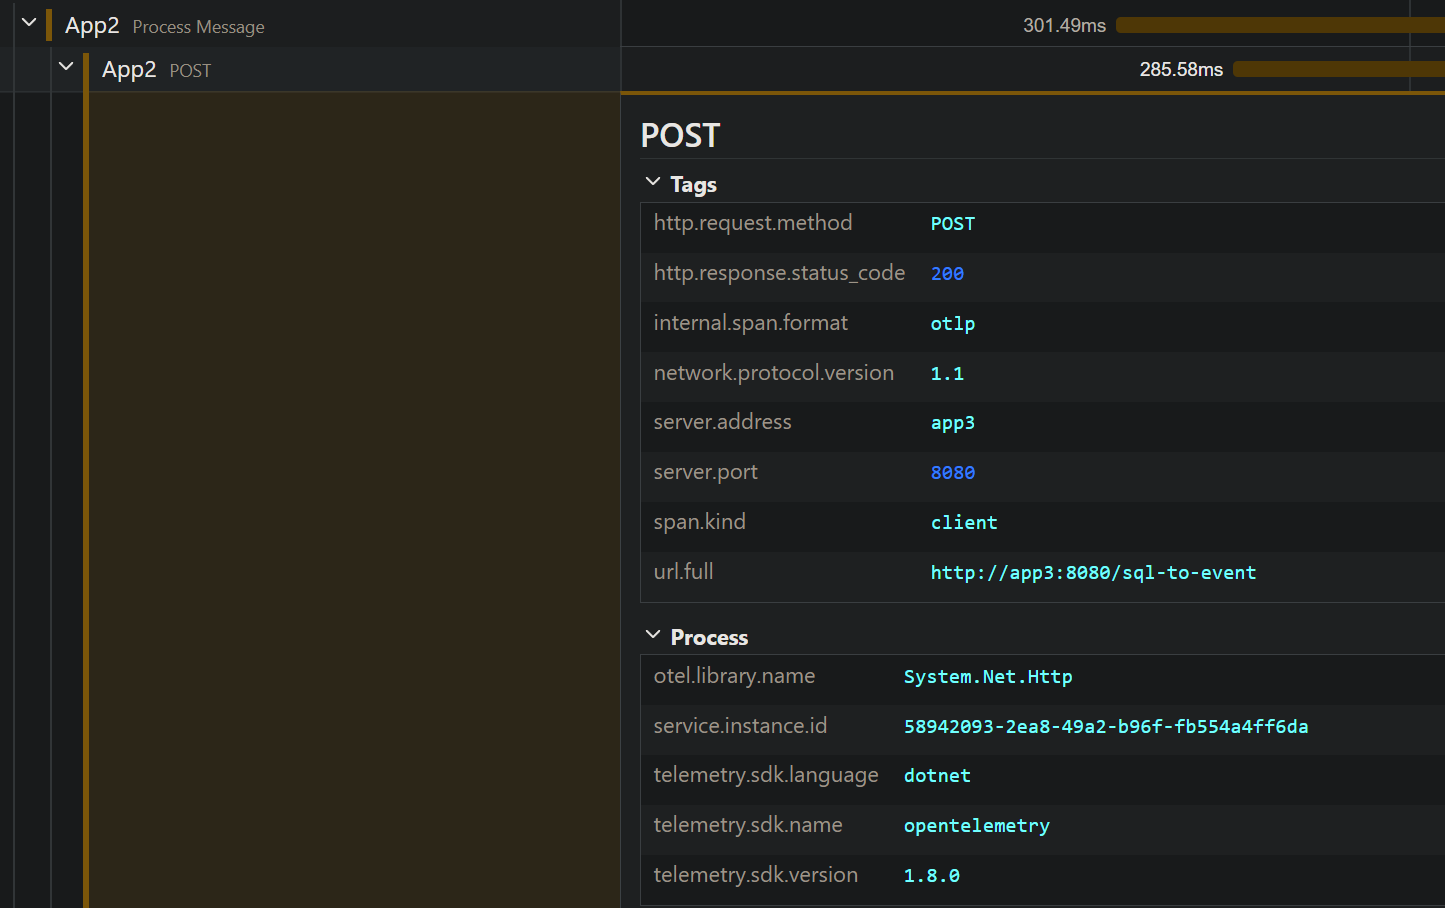
The fourth span (HTTP POST) corresponds to the HTTP request that the App2 is making to App3. This span is automatically created thanks to the
AddHttpClientInstrumentation()extension method found in the App2 setup. -
The fifth span (sql-to-event) corresponds to the App3 /sql-to-event API endpoint. This span is automatically created when the API controller is executed, thanks to the
AddAspNetCoreInstrumentation()extension method. -
The sixth span (sqlserver) corresponds to the SQL query that App3 is executing. This span is automatically created thanks to the
AddSqlClientInstrumentation()extension method. -
The seventh span (RabbitMq publish) is an Activity that we have manually created in App3.
-
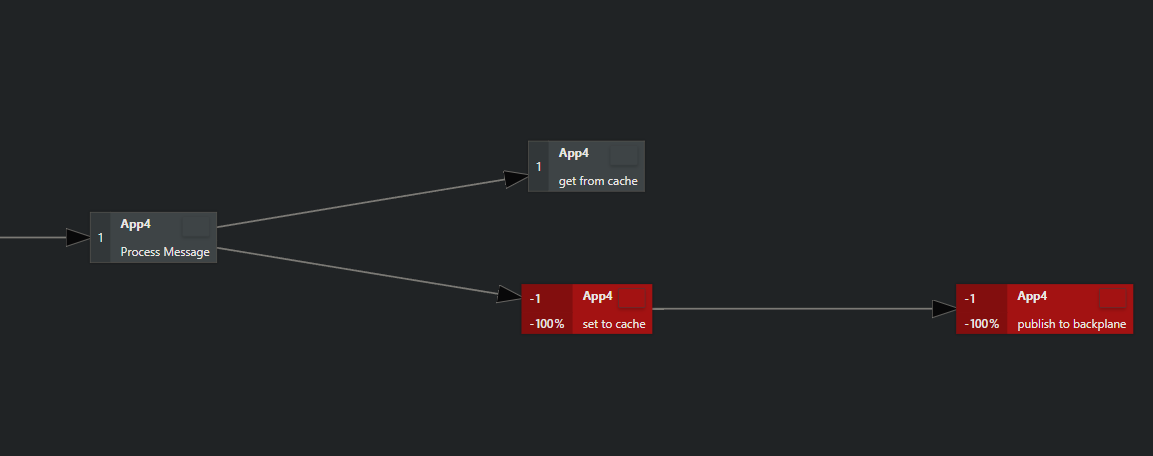
The eigth span (Process Message) is an Activity that we have manually created in App4.
-
The last three spans correspond to the Redis instructions that we are executing in App4. These three spans are automatically created thanks to the
AddFusionCacheInstrumentation()extension method.
If we want more information on any span, we can drill down and inspect the metadata. For example, if we inspect the “HTTP POST” span, we can see more details about it.
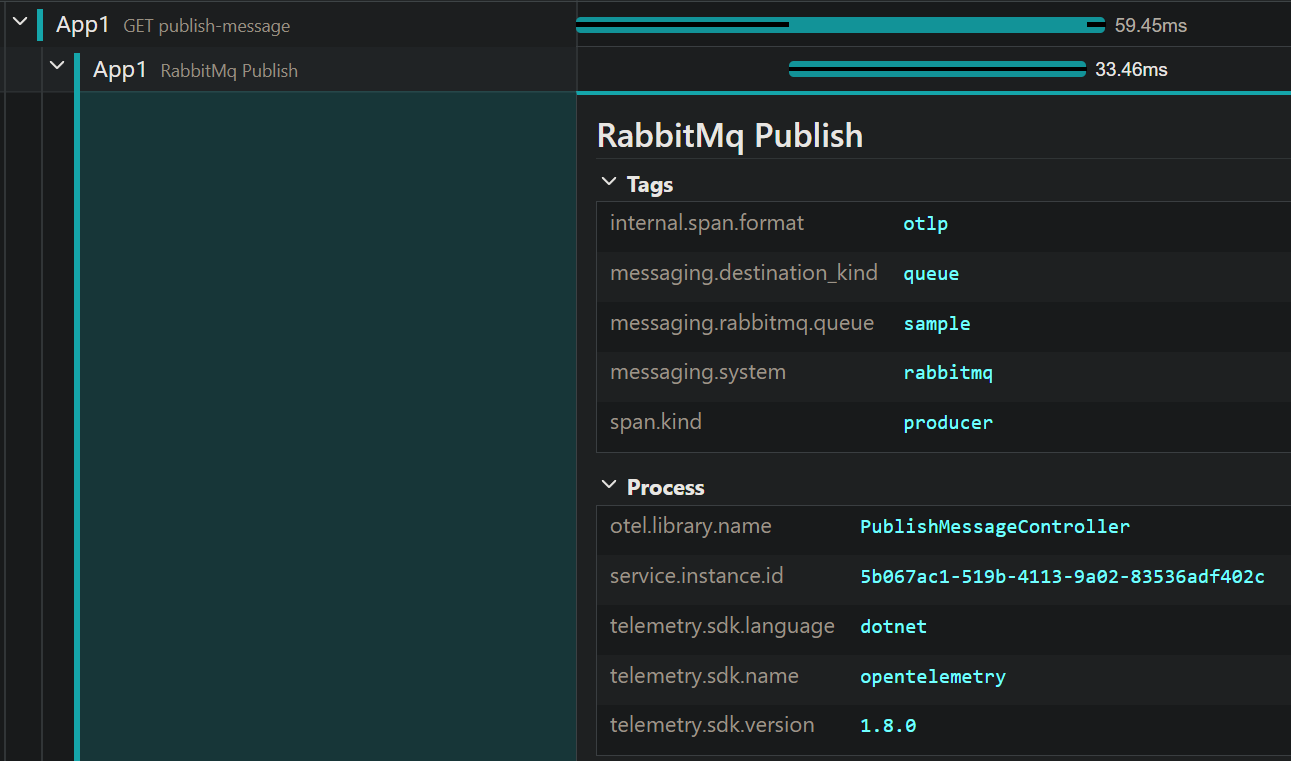
Also, do you remember that in the App1 we added some extra Tags on the Activity?
activity?.SetTag("messaging.system", "rabbitmq");
activity?.SetTag("messaging.destination_kind", "queue");
activity?.SetTag("messaging.rabbitmq.queue", "sample");
Here is the how it look on Jaeger.
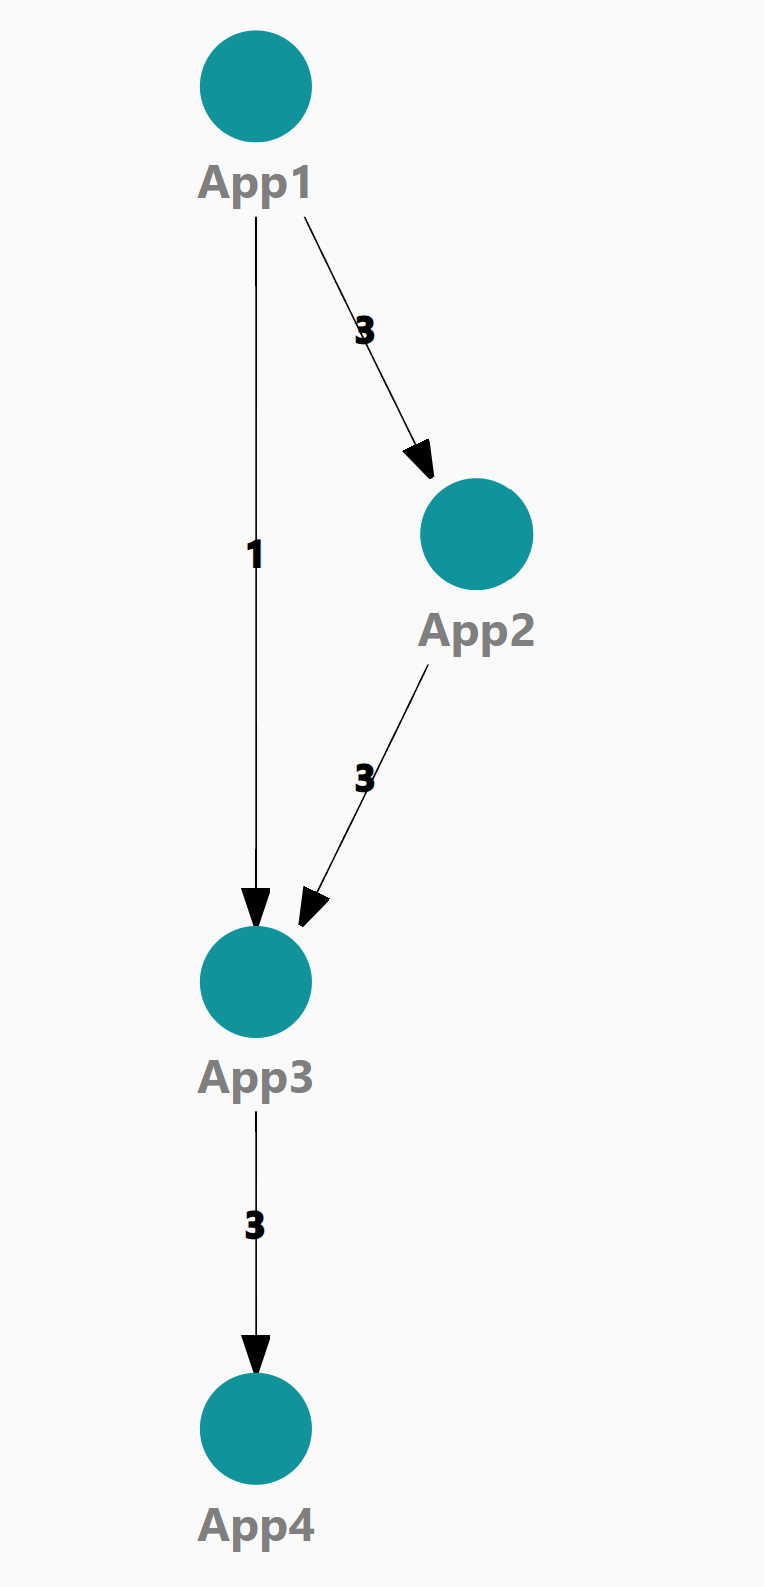
Jaeger is also capable giving you a dependency-graph after looking at the traces.
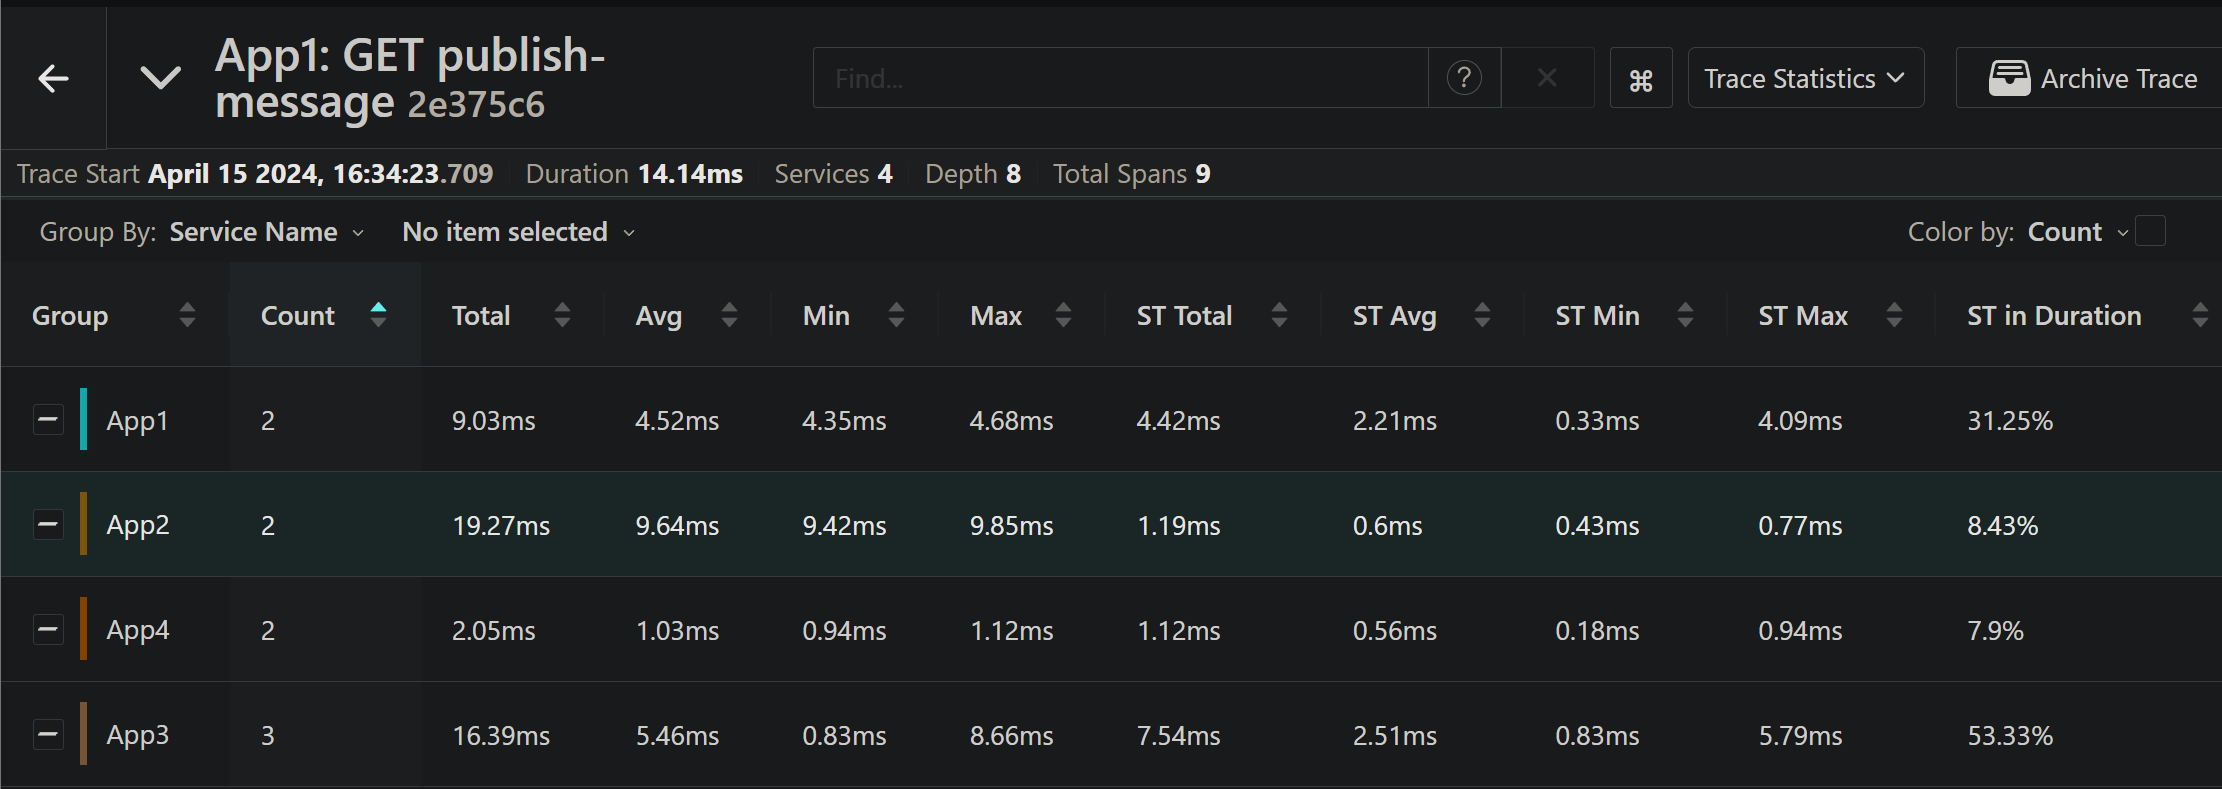
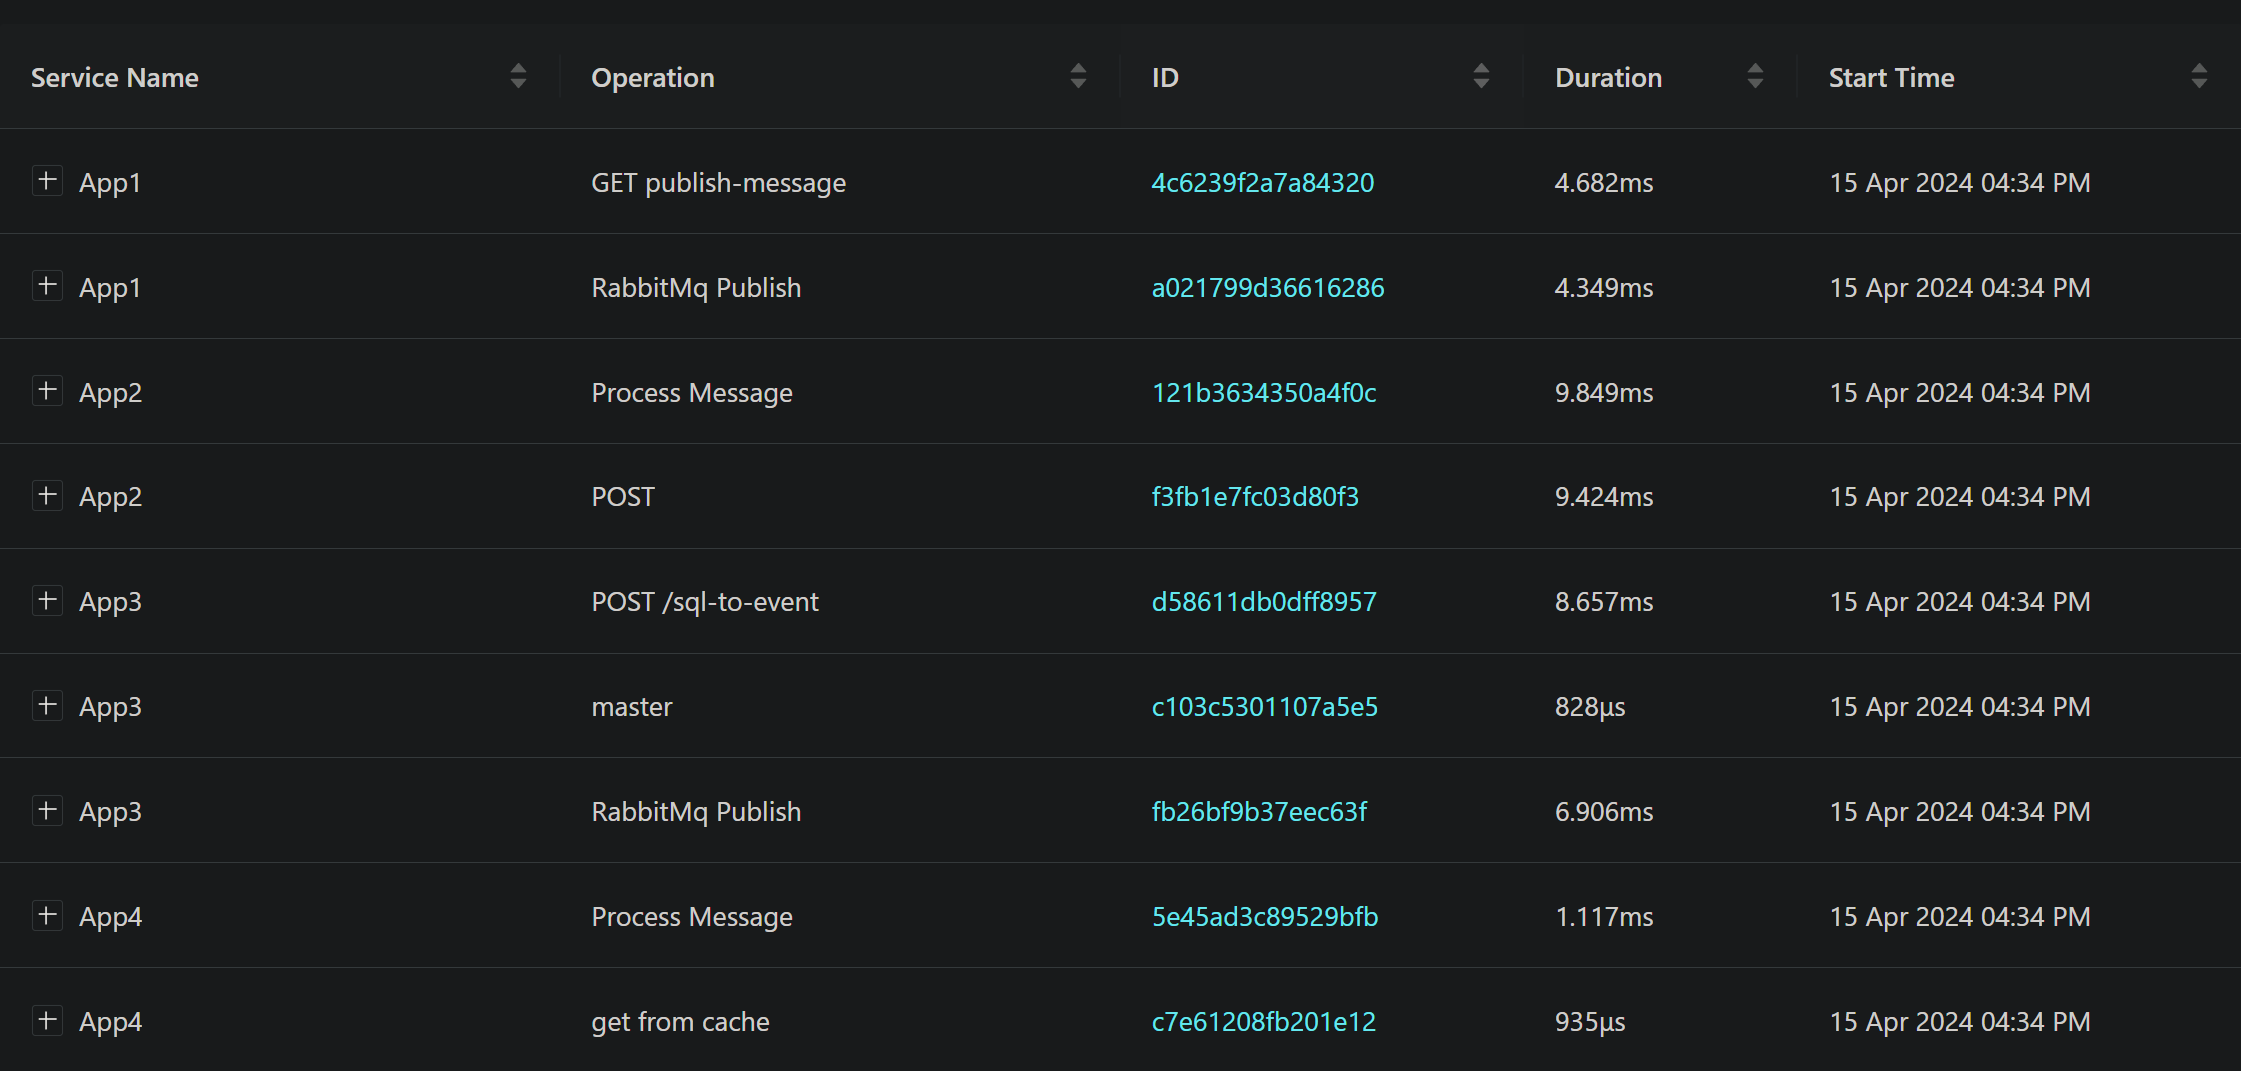
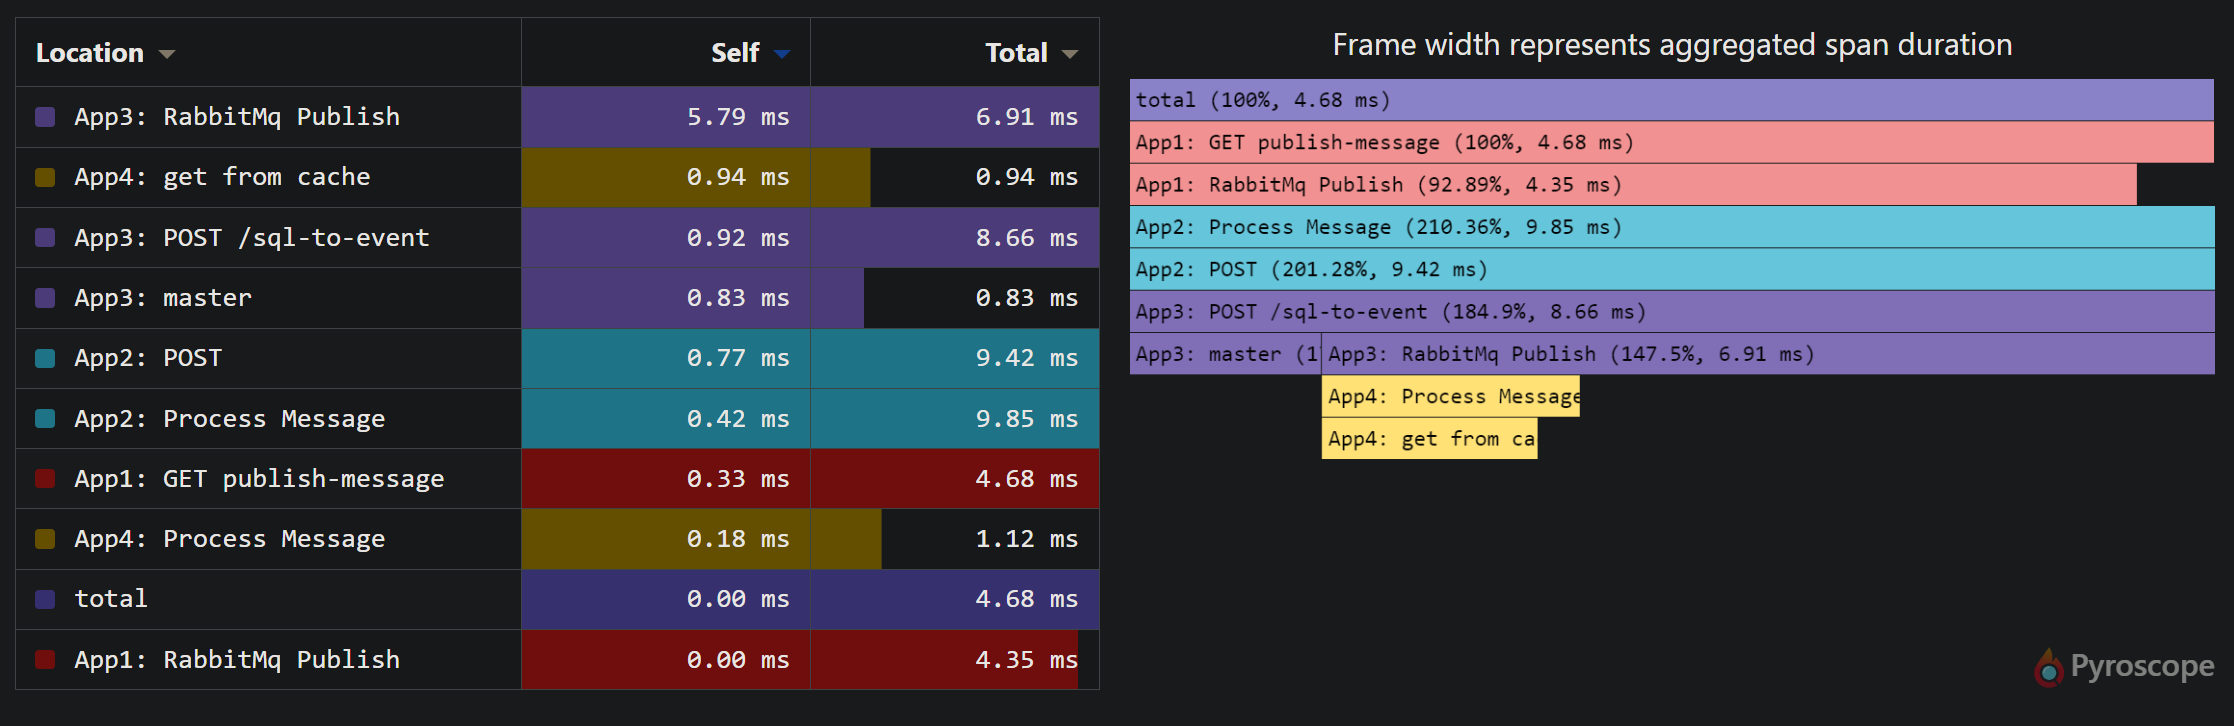
Also it is capable of giving quite a few of performance statistics.
- Trace Statistics
- Span Statistics
- Flamegraph Statistics
A comparison of traces is also possible.
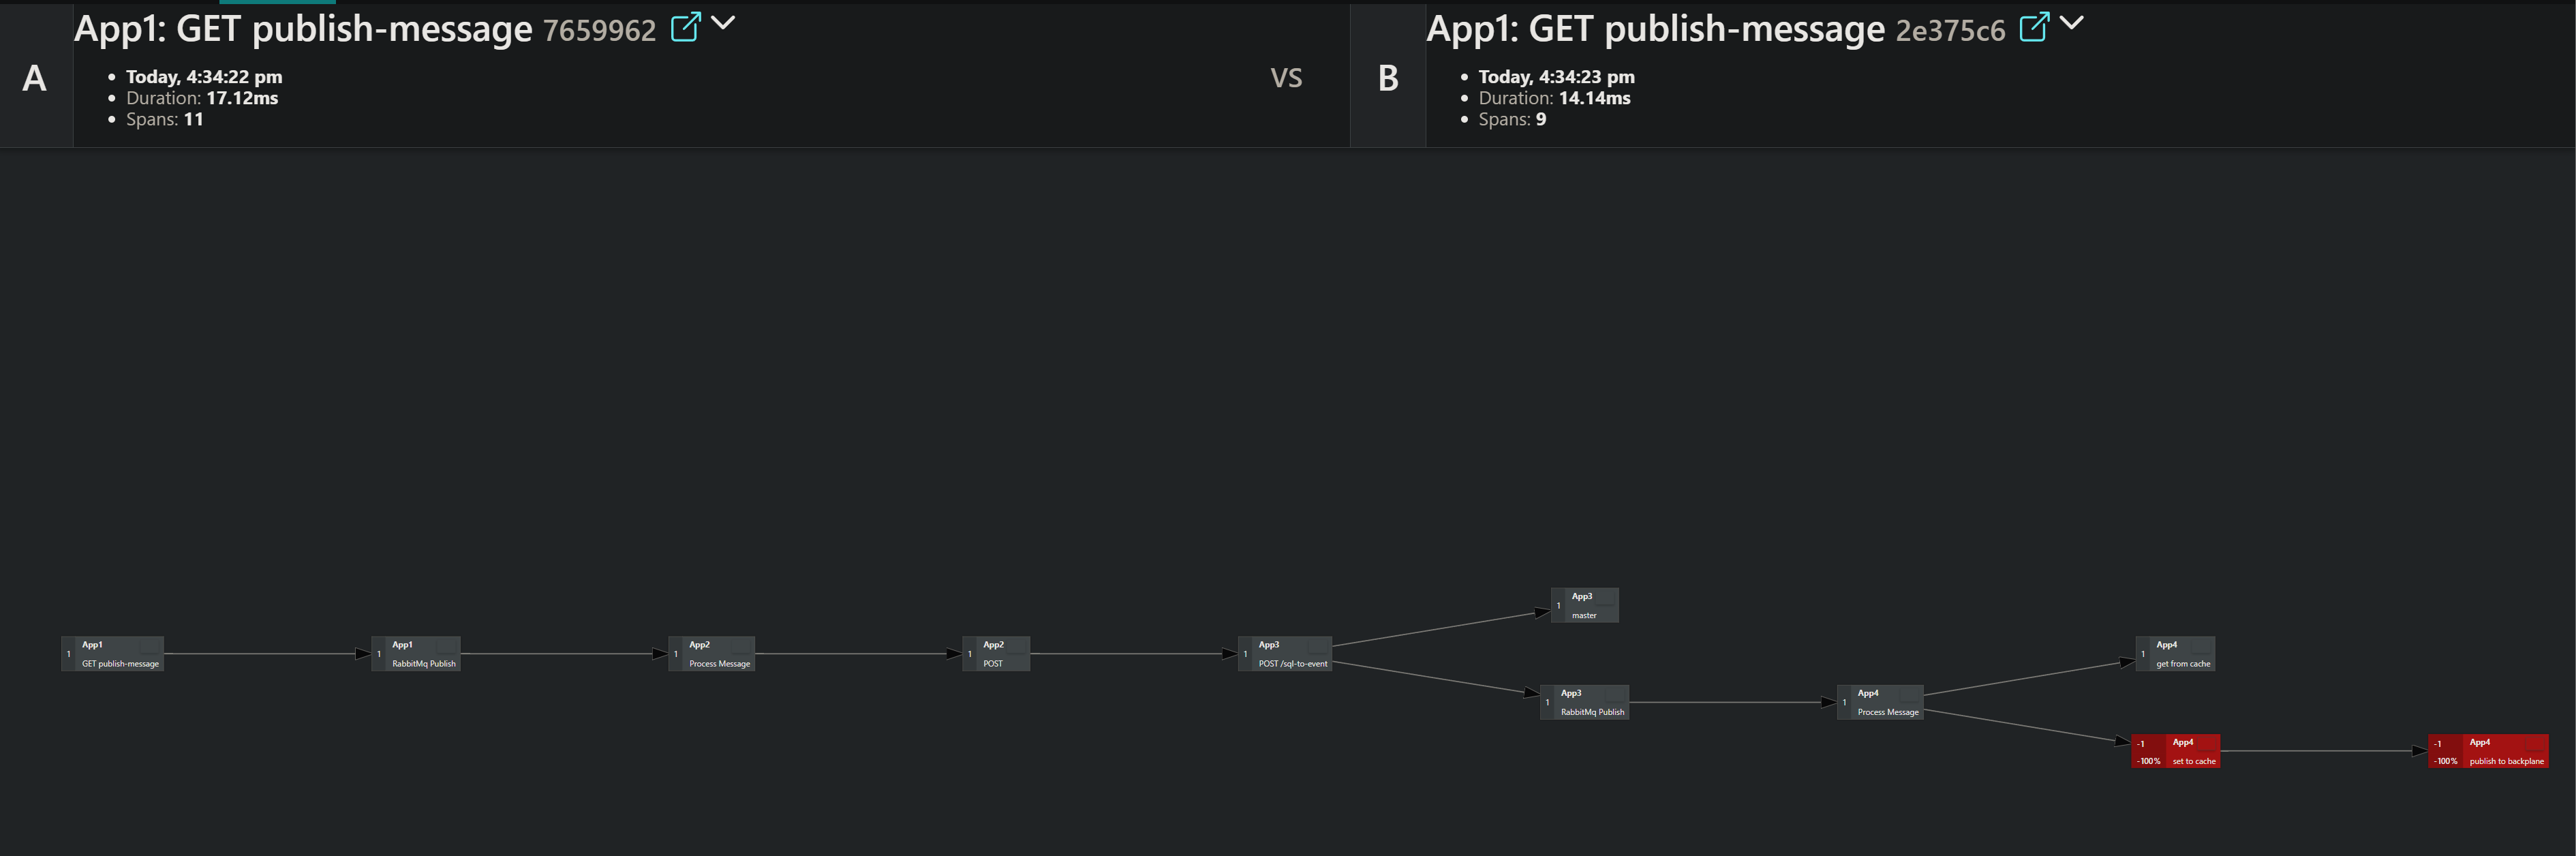
If we examine the comparison more closely, we can see that the Redis spans are not present in the second trace because we have implemented a read-through cache pattern.
How to test the example apps
If you want to take a closer look at the four applications, I have uploaded everything on my GitHub repository
If you want to try executing this example yourself, I have also uploaded a docker-compose file with everything you need. You can simply run a docker compose up, and you’re all set.
However, there’s a small caveat I wanted to mention regarding the docker-compose file.
With docker-compose, ou can control the order of service startup and shutdown using the depends_on option, but it doesn’t wait until a container is “ready” - it only waits until it’s running.
In my case, this is a problem because App2 and App4 need to wait for the RabbitMQ container to be ready. To circumvent this issue, the compose file overwrites the “entrypoint” for both apps and executes a shell script that makes both apps sleep for 30 seconds before starting up.
Here’s the docker-compose file:
version: '3.4'

networks:
  tracing:
    name: tracing-network

services:
  rabbitmq:
    image: rabbitmq:3.13.1-management
    ports:
      - 15672:15672
      - 5672
    networks:
      - tracing

  sqlserver:
    image: mcr.microsoft.com/mssql/server:2019-GA-ubuntu-16.04
    environment:
      - ACCEPT_EULA=Y
      - SA_PASSWORD=Pass@Word1
    ports:
      - 1433
    networks:
      - tracing

  redis:
    image: redis:7.2.4
    ports:
    - 6379:6379
    networks:
      - tracing

  jaeger:
    image: jaegertracing/all-in-one:1.56.0
    container_name: jaeger
    restart: unless-stopped
    ports:
      - 5775:5775/udp
      - 6831:6831/udp
      - 6832:6832/udp
      - 5778:5778
      - 16686:16686
      - 14250:14250
      - 14268:14268
      - 14269:14269
      - 4317:4317
      - 4318:4318
      - 9411:9411
    networks:
      - tracing
    environment:
      COLLECTOR_OTLP_ENABLED: true

  app1:
    build:
      context: ./App1.WebApi
    ports:
      - "5000:8080"
    networks:
      - tracing
    depends_on:
      - rabbitmq
      - jaeger
      - app3
    environment:
      Jaeger__Protocol: http
      Jaeger__Port: 4317
      Jaeger__Host: jaeger
      RabbitMq__Host: rabbitmq
      App3Endpoint: http://app3:8080

  app2:
    stdin_open: true
    tty: true
    build:
      context: ./App2.RabbitConsumer.Console
    networks:
      - tracing
    depends_on:
      - rabbitmq
      - jaeger
      - app3
    entrypoint: ["./wait.sh", "30", "dotnet", "App2.RabbitConsumer.Console.dll"]
    environment:
      Jaeger__Protocol: http
      Jaeger__Port: 4317
      Jaeger__Host: jaeger
      RabbitMq__Host: rabbitmq
      App3UriEndpoint: http://app3:8080

  app3:
    build:
      context: ./App3.WebApi
    ports:
      - "5001:8080"
    networks:
      - tracing
    depends_on:
      - rabbitmq
      - jaeger
      - sqlserver
    environment:
      Jaeger__Protocol: http
      Jaeger__Port: 4317
      Jaeger__Host: jaeger
      RabbitMq__Host: rabbitmq
      SqlDbConnString: server=sqlserver;user id=sa;password=Pass@Word1;

  app4:
    build:
      context: ./App4.RabbitConsumer.HostedService
    networks:
      - tracing
    depends_on:
      - rabbitmq
      - jaeger
      - redis
    entrypoint: ["./wait.sh", "30", "dotnet", "App4.RabbitConsumer.HostedService.dll"]
    environment:
      Jaeger__Protocol: http
      Jaeger__Port: 4317
      Jaeger__Host: jaeger
      RabbitMq__Host: rabbitmq
      Redis__Host: redis
      Redis__Port: 6379