Analyze Polly Telemetry using Prometheus, Grafana and OpenTelemetry Metrics
Just show me the code!
As always, if you don’t care about the post I have uploaded the source code on my Github.
This post does not aim to be an introductory post on how the Polly library works, how to configure its various strategies, etc. There are already multiple posts on the Internet that explain these topics very well.
I also won’t be delving into the specific details of how OpenTelemetry Metrics works.
If you want to learn more about OpenTelemetry Metrics and how to use it with .NET, you can read my introductory post that I wrote a few months ago.
Here’s a link to my “Getting started with OpenTelemetry Metrics in .NET” blog post.
The goal of this post is to show you how we can use OpenTelemetry Metrics to send the Telemetry generated by Polly to Prometheus for subsequent analysis by setting up a series of dashboards in Grafana.
It’s important to mention that Polly provides Telemetry for all built-in resilience strategies starting with version 8. It’s crucial to emphasize that this post does not work with versions of Polly earlier than version 8.
So, without further ado, let’s get started.
What is Polly?
Polly is a .NET library that aids in building resilient and fault-tolerant applications.
It is primarily used for improving the stability and resilience of a .NET application by handling transient faults, system failures, and network outages. The library helps developers implement various resilience patterns, such as retries, circuit breakers, and timeouts, to improve the reliability of your applications.
- Would you like to learn more about it? Visit its official Github repository
Enable Telemetry on Polly
By default, Polly Telemetry is disabled. To enable it you need to install the Polly.Extensions NuGet package and use the ConfigureTelemetry extension method when building any resilience strategy.
- The following code snippet demonstrates a basic example where we enable telemetry while constructing a Timeout Polly strategy.
var builder = new ResiliencePipelineBuilder()
    .AddTimeout(TimeSpan.FromSeconds(1))
    .ConfigureTelemetry(new NullLoggerFactory())
    .Build();
The ConfigureTelemetry extension method can be setup in a couple different ways:
- To accept an
ILoggerFactoryinstance, which will allow us to log any Telemetry event.
public static TBuilder ConfigureTelemetry<TBuilder>(this TBuilder builder, ILoggerFactory loggerFactory)
        where TBuilder : ResiliencePipelineBuilderBase
    {
        Guard.NotNull(builder);
        Guard.NotNull(loggerFactory);

        return builder.ConfigureTelemetry(new TelemetryOptions { LoggerFactory = loggerFactory });
    }
- To accept a
TelemetryOptionsinstance:
public static TBuilder ConfigureTelemetry<TBuilder>(this TBuilder builder, TelemetryOptions options)
    where TBuilder : ResiliencePipelineBuilderBase
{
    Guard.NotNull(builder);
    Guard.NotNull(options);

    ValidationHelper.ValidateObject(new(options, $"The '{nameof(TelemetryOptions)}' are invalid."));
    builder.TelemetryListener = new TelemetryListenerImpl(options);

    return builder;
}
The TelemetryOptions object allows us to do more than just log Polly Telemetry events; it also enables us to configure Telemetry listeners and add custom tags to any event generated by a Polly strategy.
- Here’s how the
TelemetryOptionsobject looks like:
public class TelemetryOptions
{
    /// <summary>
    /// Gets the collection of telemetry listeners.
    /// </summary>
    /// <value>
    /// The default value is an empty collection.
    /// </value>
    public ICollection<TelemetryListener> TelemetryListeners { get; } = new List<TelemetryListener>();

    /// <summary>
    /// Gets or sets the logger factory.
    /// </summary>
    /// <value>
    /// The default value is <see cref="NullLoggerFactory.Instance"/>.
    /// </value>
    [Required]
    public ILoggerFactory LoggerFactory { get; set; } = NullLoggerFactory.Instance;

    /// <summary>
    /// Gets the collection of telemetry enrichers.
    /// </summary>
    /// <value>
    /// The default value is an empty collection.
    /// </value>
    public ICollection<MeteringEnricher> MeteringEnrichers { get; } = new List<MeteringEnricher>();

    /// <summary>
    /// Gets or sets the result formatter.
    /// </summary>
    /// <value>
    /// The default value is a formatter that returns a status code for HTTP based responses and the result as-is for all other result types.
    /// This property is required.
    /// </value>
    [Required]
    public Func<ResilienceContext, object?, object?> ResultFormatter { get; set; } = (_, result) => result switch
    {
        HttpResponseMessage response => (int)response.StatusCode,
        _ => result,
    };
}
Polly Metrics and Instruments
In this section, I will explore the Instruments and Metrics that are built into Polly.
The Polly built-in Telemetry implementation can be found in the Polly.Telemetry.TelemetryListenerImpl class.
Within this class, we find the Meter and the Instruments responsible for reporting Measuments. Those are fundamental concepts in OpenTelemetry Metrics.
Let’s do a very quick recap of what each of these terms means:
- A
Meteris responsible for creatingInstrumentsand it must provide a series of functions to create newInstruments. - A
Metercan be associated with one or moreInstruments, each of which is used to create a series ofMeasurements. Measurementsare what we create or observe in our applications.
If we take a look at the TelemetryListenerImpl class, we can see that all the metrics emitted by the Polly library can be found within this single Meter.
internal static readonly Meter Meter = new(TelemetryUtil.PollyDiagnosticSource, "1.0");
The
TelemetryUtil.PollyDiagnosticSourceis nothing more than a string:
internal const string PollyDiagnosticSource = "Polly";
The above Meter has 3 built-in Instruments capable of emitting Measurements:
Counter = Meter.CreateCounter<int>(
        "resilience.polly.strategy.events",
        description: "Tracks the number of resilience events that occurred in resilience strategies.");

AttemptDuration = Meter.CreateHistogram<double>(
    "resilience.polly.strategy.attempt.duration",
    unit: "ms",
    description: "Tracks the duration of execution attempts.");

ExecutionDuration = Meter.CreateHistogram<double>(
    "resilience.polly.pipeline.duration",
    unit: "ms",
    description: "The execution duration of resilience pipelines.");
These are the Instruments responsible for generating the Polly metrics that we will send to Prometheus and Grafana for more a comprehensive analysis of our application.
Demo Application
In the previous section, we have seen how to enable the built-in Telemetry in Polly and also which metrics will be emitted by it. Now it’s time to build an app that generates some of those metrics.
The following diagram shows what we’re going to build from this point forward.
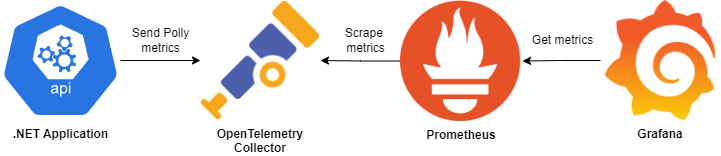
- A .NET WebAPI that makes calls to the https://jsonplaceholder.typicode.com/ API, utilizing various Polly strategies to enhance resiliency during these HTTP requests.
- The WebApi uses the OpenTelemetry OTLP exporter package (
OpenTelemetry.Exporter.OpenTelemetryProtocol) to send the Polly Telemetry to an OpenTelemetry Collector. - A Prometheus server that retrieves the Polly metric data from the OTEL Collector.
- A Grafana server, where we can create dashboard panels to visualize the Polly metrics received from the WebAPI.
Building the .NET WebApi
The application is a simple .NET 7 WebApi that makes calls to the jsonplaceholder.typicode.com API and returns the result.
The application features 2 endpoints: /Comments and /Users.
1. Building the /comments endpoint
This endpoint makes a call to the https://jsonplaceholder.typicode.com/posts/{commentId}/comments endpoint and returns the result.
To invoke the TypiCode API, the app will use an HttpClient with a Polly Retry/Timeout strategy attached to it.
The first step is to create the Polly Strategy, which will exhibit the following behavior:
- It will handle any exceptions or 500 status codes returned by the TypiCode API.
- In the event of an HTTP call failure, it will retry the call up to 5 times with a 5-second delay between each retry.
- If the HTTP call doesn’t receive a response within 5 seconds, it will be canceled.
The next code snippet shows the Polly Strategy implementation. Notice how, when building the Polly Strategy, we are using the ConfigureTelemetry() extension method. This is because we want metrics to be generated every time this Strategy is executed.
If we don’t use the ConfigureTelemetry() extension method when creating the Pipeline, then there won’t any metric for us to work with.
Additionally, we are outputting the Telemetry data to the Console using the LoggerFactory.Create(bld => bld.AddConsole() delegate method.
public static ResiliencePipeline<HttpResponseMessage> CreateRetryStrategy()
{
    var retry = new ResiliencePipelineBuilder<HttpResponseMessage>
    {
        Name = "TypiCodeCommentsRetryPipeline"
    };

    var pipeline = retry.AddRetry(new RetryStrategyOptions<HttpResponseMessage>
    {
        ShouldHandle = new PredicateBuilder<HttpResponseMessage>()
            .Handle<Exception>()
            .HandleResult(r => r.StatusCode == HttpStatusCode.InternalServerError),
        Name = "RetryStrategy",
        MaxRetryAttempts = 5,
        Delay = TimeSpan.FromSeconds(5),
        OnRetry = arg =>
        {
            Console.WriteLine("OnRetry, Attempt: {0}", arg.AttemptNumber);
            return default;
        }
    })
    .AddTimeout(TimeSpan.FromSeconds(5))
    .ConfigureTelemetry(LoggerFactory.Create(bld => bld.AddConsole()))
    .Build();

    return pipeline;
}
Now, let’s create the HttpClient and attach the Polly Strategy.
To create the HttpClient, I will use the AddHttpClient extension method from the Microsoft.Extensions.DependencyInjection package. This method adds the IHttpClientFactory and related services to the DI container and configures a named HttpClient for me.
To attach the Polly Strategy we have created earlier, we will use the AddPolicyHandler() extension method. This method adds a PolicyHttpMessageHandler which will surround request execution with the provided policy.
There is a caveat here: you need to use the AsAsyncPolicy() method from the Polly package. This method converts a ResiliencePipeline into an IAsyncPolicy. It’s necessary because the AddPolicyHandler() method only accepts an IAsyncPolicy parameter.
The next code snippet shows the implementation.
builder.Services.AddHttpClient("typicode-comments", c =>
{
    c.BaseAddress = new Uri(builder.Configuration.GetValue<string>("TypiCodeBaseUri") ??
                            throw new InvalidOperationException());
    c.DefaultRequestHeaders.Add("accept", "application/json");

}).AddPolicyHandler(PollyResiliencePipelines.CreateRetryStrategy().AsAsyncPolicy());
And the last step is to create the /comments endpoint itself.
[ApiController]
[Route("[controller]")]
public class CommentsController : ControllerBase
{
    private readonly IHttpClientFactory _httpClientFactory;

    public CommentsController(IHttpClientFactory httpClientFactory)
    {
        _httpClientFactory = httpClientFactory;
    }

    [HttpGet()]
    public async Task<IActionResult> Get(int commentId, CancellationToken ct)
    {
        var client = _httpClientFactory.CreateClient("typicode-comments");

        var response = await client.GetAsync(
            $"posts/{commentId}/comments", ct);

        if (response.IsSuccessStatusCode)
            return Ok(await response.Content.ReadAsStringAsync());

        return StatusCode(500);
    }
}
2. Building the /users endpoint
This endpoint makes a call to the https://jsonplaceholder.typicode.com/users/{userId} endpoint and returns the result.
To invoke the TypiCode API, the app will use an HttpClient with a Polly Circuit Breaker Strategy attached to it.
The first step is to create the Polly Circuit Breaker Strategy, which will exhibit the following behavior:
- It will handle exceptions of type HttpRequestException or 500 status codes returned by the TypiCode API.
- If there are more than 5 HTTP calls within 30 seconds, and 30% of them result in a failure, the circuit will open for 15 seconds.
The following code snippet shows the implementation of the Polly Circuit Breaker Strategy. Notice how, when building the Polly Strategy, we are using the ConfigureTelemetry() extension method. This is because we want metrics to be generated every time this Strategy is executed.
Additionally, we are adding a custom tag to our metrics. To achieve this, you need to create a class that inherits from the MeteringEnricher class and then add your custom enricher to the TelemetryOptions.MeteringEnrichers list.
public static ResiliencePipeline<HttpResponseMessage> CreateCircuitBreakerStrategy()
{

    var circuitBreaker = new ResiliencePipelineBuilder<HttpResponseMessage>
    {
        Name = "TypiCodeUsersCircuitBreakerPipeline"
    };

    var pipeline = circuitBreaker.AddCircuitBreaker(new CircuitBreakerStrategyOptions<HttpResponseMessage>
    {
        ShouldHandle = new PredicateBuilder<HttpResponseMessage>()
            .Handle<HttpRequestException>()
            .HandleResult(r => r.StatusCode == HttpStatusCode.InternalServerError),
        Name = "CircuitBreakerStrategy",
        BreakDuration = TimeSpan.FromSeconds(15),
        FailureRatio = .3,
        MinimumThroughput = 5,
        SamplingDuration = TimeSpan.FromSeconds(30),
        OnOpened = arg =>
        {
            Console.WriteLine("Circuit Breaker Opened, Duration: {0}", arg.BreakDuration);
            return default;
        },
        OnClosed = _ =>
        {
            Console.WriteLine("Circuit Breaker Closed");
            return default;
        },
        OnHalfOpened = _ =>
        {
            Console.Write("Circuit Breaker Half Opened");
            return default;
        }
    })
    .ConfigureTelemetry(new TelemetryOptions
    {
        MeteringEnrichers = { new CircuitBreakerMetersEnricher() }
    })
    .Build();

    return pipeline;
}
The following code snippet illustrates the implementation of this custom enricher. This enricher adds the duration of the open circuit into the OnCircuitOpened events.
internal class CircuitBreakerMetersEnricher : MeteringEnricher
{
    public override void Enrich<TResult, TArgs>(in EnrichmentContext<TResult, TArgs> context)
    {
        if (context.TelemetryEvent.Arguments is OnCircuitOpenedArguments<TResult> onCircuitOpenedArgs)
        {
            context.Tags.Add(new("circuitbreaker.open.duration", onCircuitOpenedArgs.BreakDuration));
        }
    }
}
Now, let’s create the HttpClient and attach the Polly Circuit Breaker Strategy. The source code is exactly the same as the one mentioned above, so there’s no need to repeat it.
builder.Services.AddHttpClient("typicode-comments", c =>
{
    c.BaseAddress = new Uri(builder.Configuration.GetValue<string>("TypiCodeBaseUri") ??
                            throw new InvalidOperationException());
    c.DefaultRequestHeaders.Add("accept", "application/json");

}).AddPolicyHandler(PollyResiliencePipelines.CreateRetryStrategy().AsAsyncPolicy());
And the final step is to create the /users endpoint itself.
[ApiController]
[Route("[controller]")]
public class UsersController : ControllerBase
{
    private readonly IHttpClientFactory _httpClientFactory;
    public UsersController(IHttpClientFactory httpClientFactory)
    {
        _httpClientFactory = httpClientFactory;
    }

    [HttpGet()]
    public async Task<IActionResult> Get(int userId, CancellationToken ct)
    {
        var client = _httpClientFactory.CreateClient("typicode-users");

        var response = await client.GetAsync(
            $"users/{userId}", ct);

        if (response.IsSuccessStatusCode)
            return Ok(await response.Content.ReadAsStringAsync());

        return StatusCode(500);
    }
}
3. Configuring the .NET OpenTelemetry Metrics provider
In the last 2 sections, we have created 2 Polly strategies, enabled Telemetry for each of them, and incorporated them into their respective HTTP clients. However, all this effort is pointless unless we send the Polly Telemetry someplace where we can analyze it.
In this section, we will configure OpenTelemetry Metrics to send Polly’s metrics to an OpenTelemetry Collector.
The following code snippet shows how to set up OpenTelemetry Metrics to export Polly Telemetry.
builder.Services.AddOpenTelemetry().WithMetrics(opts => opts
    .SetResourceBuilder(ResourceBuilder.CreateDefault().AddService("PollyTelemetryDemo.WebApi"))
    .AddMeter("Polly")
    .AddOtlpExporter(options =>
    {
        options.Endpoint = new Uri(builder.Configuration.GetValue<string>("OtlpEndpointUri")
                                    ?? throw new InvalidOperationException());
    }));
As you can see, the configuration is quite standard. The only point worth commenting on is the use of the AddMeter("Polly") extension method.
Do you remember that at the beginning of the post, we mentioned that all Polly metrics are emitted by Instruments within a Meter named “Polly”? The AddMeter("Polly") extension method configures OpenTelemetry to transmit all the metrics collected by this particular “Polly” Meter.
If we omit the AddMeter("Polly") line during the configuration of the OpenTelemetry Metrics provider, the metrics generated by Polly will not be sent to the OpenTelemetry Collector.
OpenTelemetry Collector
The OpenTelemetry Collector consists of three components:
Receivers: Can be push or pull based, is how data gets into the Collector.Processors: Run on data between being received and being exported.Exporters: Can be push or pull based, is how you send data to one or more backends/destinations.
In this case, the OpenTelemetry Collector receives the Polly metrics from the .NET API via gRPC and exports them into Prometheus.
The following code snippet demonstrates how the OpenTelemetry Collector is configured.
receivers:
  otlp:
    protocols:
      grpc:

exporters:
  prometheus:
    endpoint: "0.0.0.0:8889"

processors:
  batch:

extensions:
  health_check:

service:
  extensions: [health_check]
  pipelines:
    metrics:
      receivers: [otlp]
      processors: [batch]
      exporters: [prometheus]
Prometheus
Prometheus is setup to scrape the OpenTelemetry Collector metrics endpoints every 5 seconds.
global:
  scrape_interval: 15s

scrape_configs:
  - job_name: 'otel-collector'
    scrape_interval: 5s
    static_configs:
      - targets: ['otel-collector:8889']
      - targets: ['otel-collector:8888']
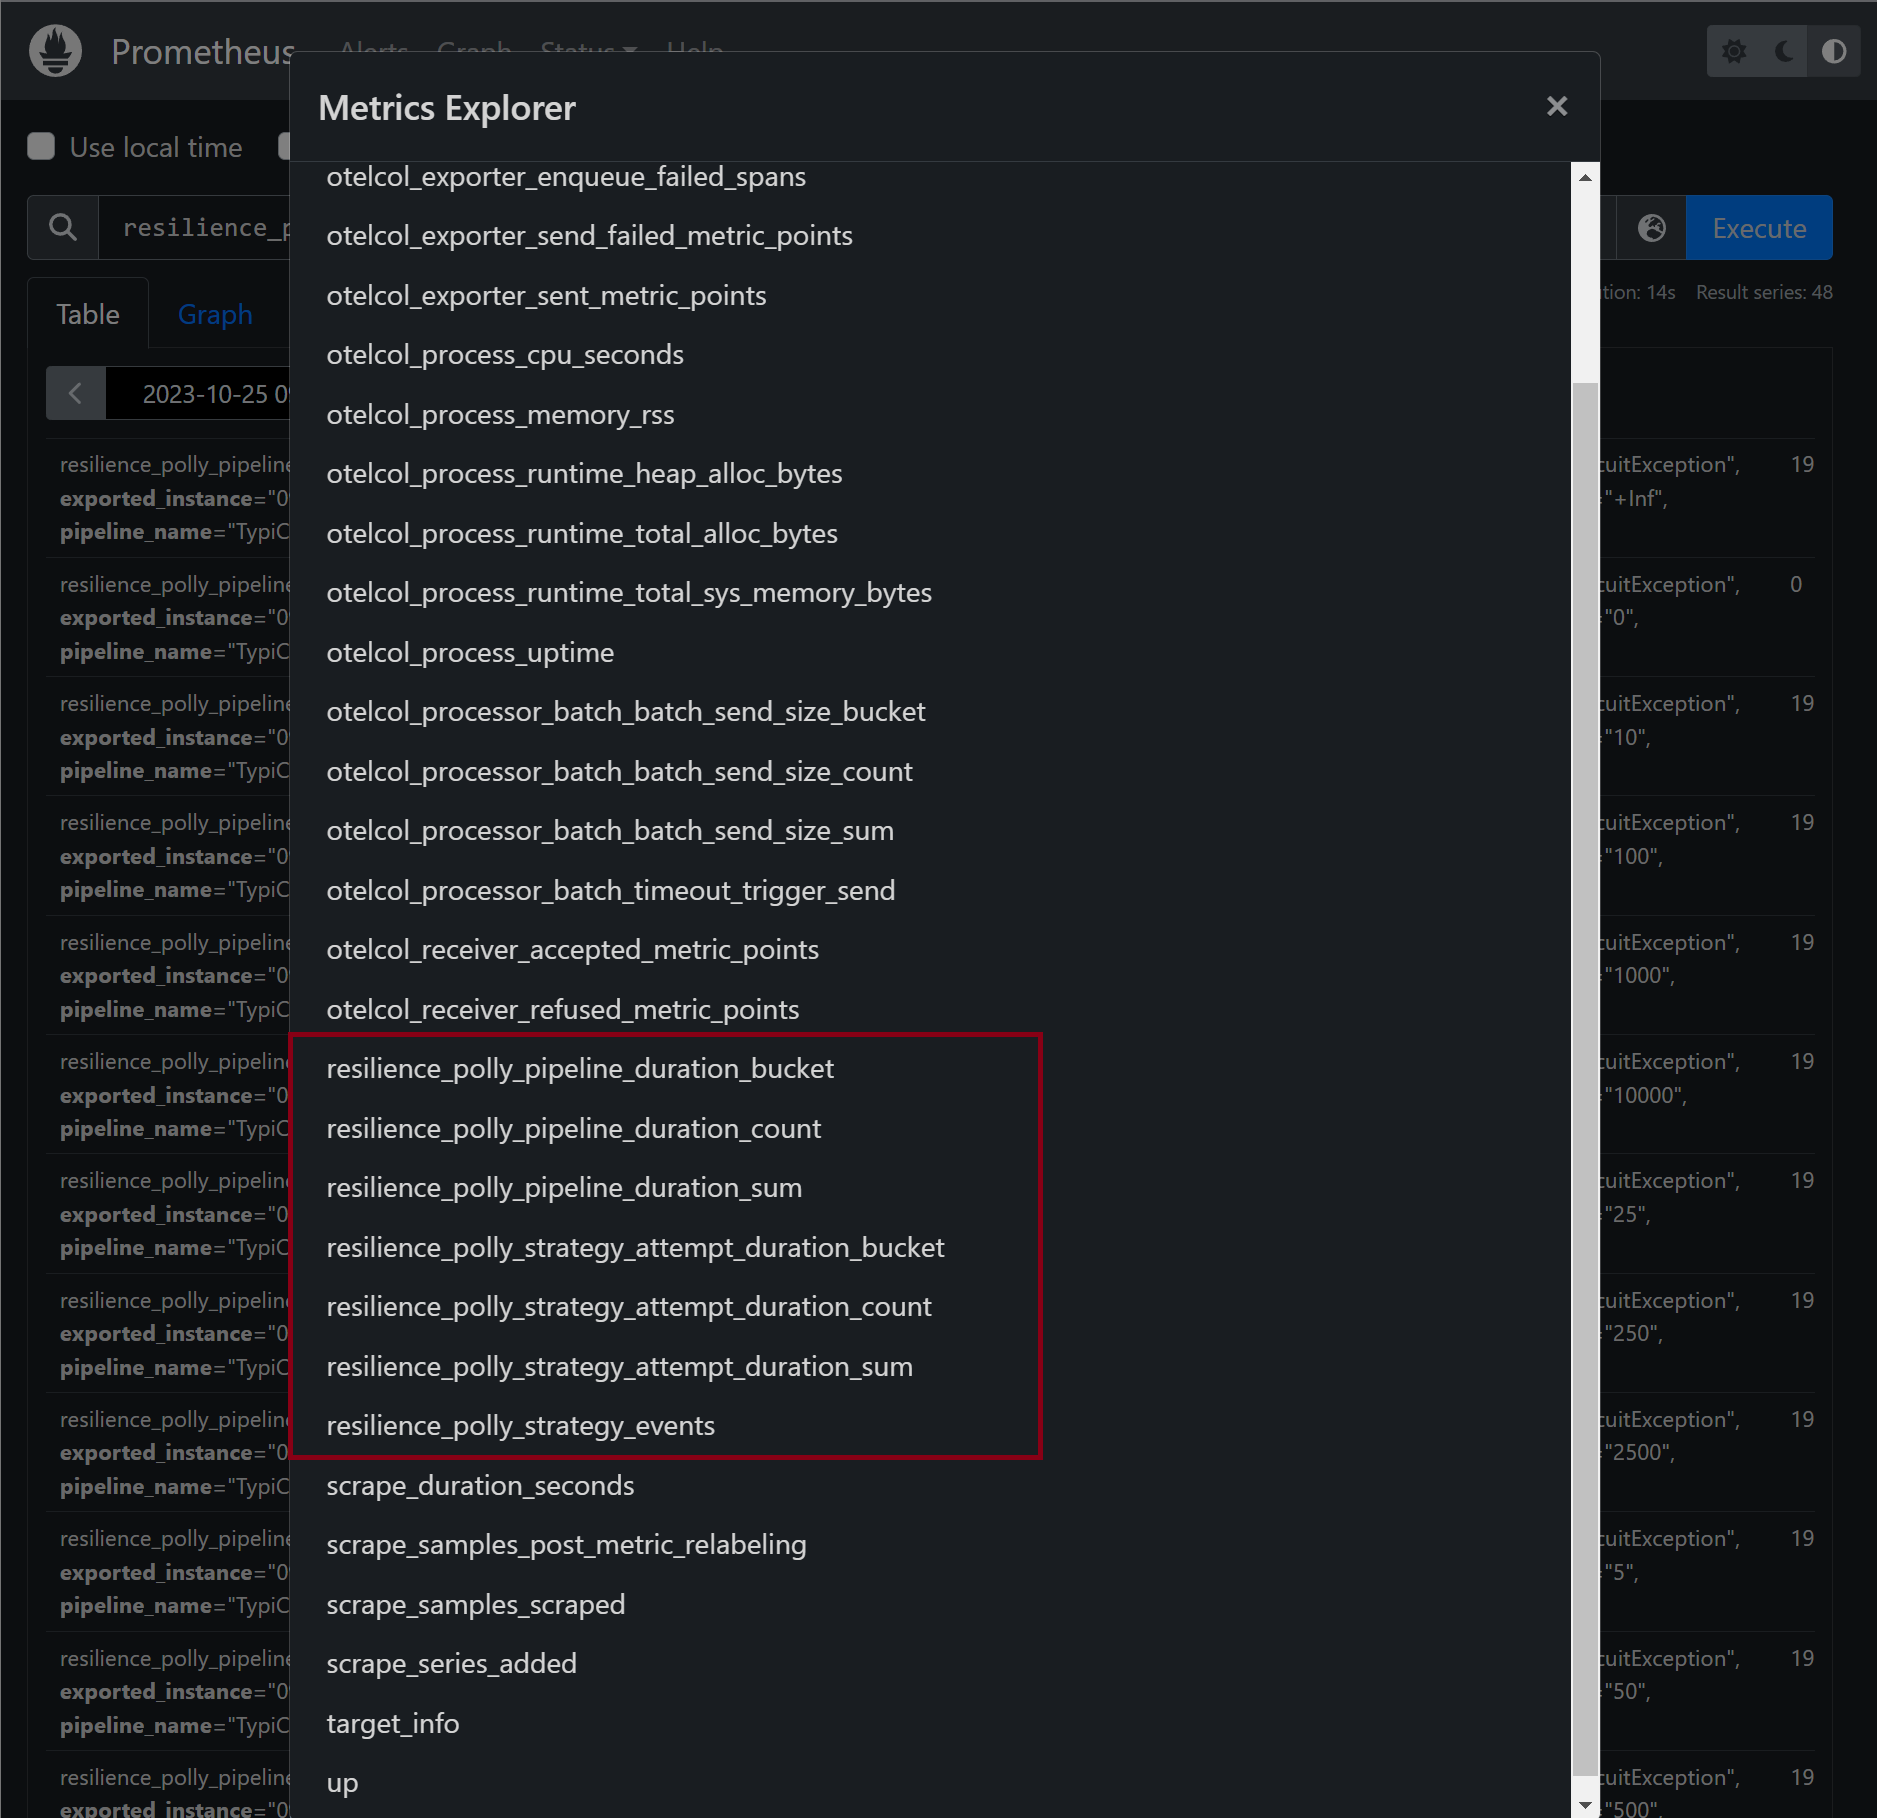
Once we have configured Prometheus, if we access the .NET API and execute it a few times to generate a certain number of metrics, we will be able to see in Prometheus how the Polly metrics start to appear.
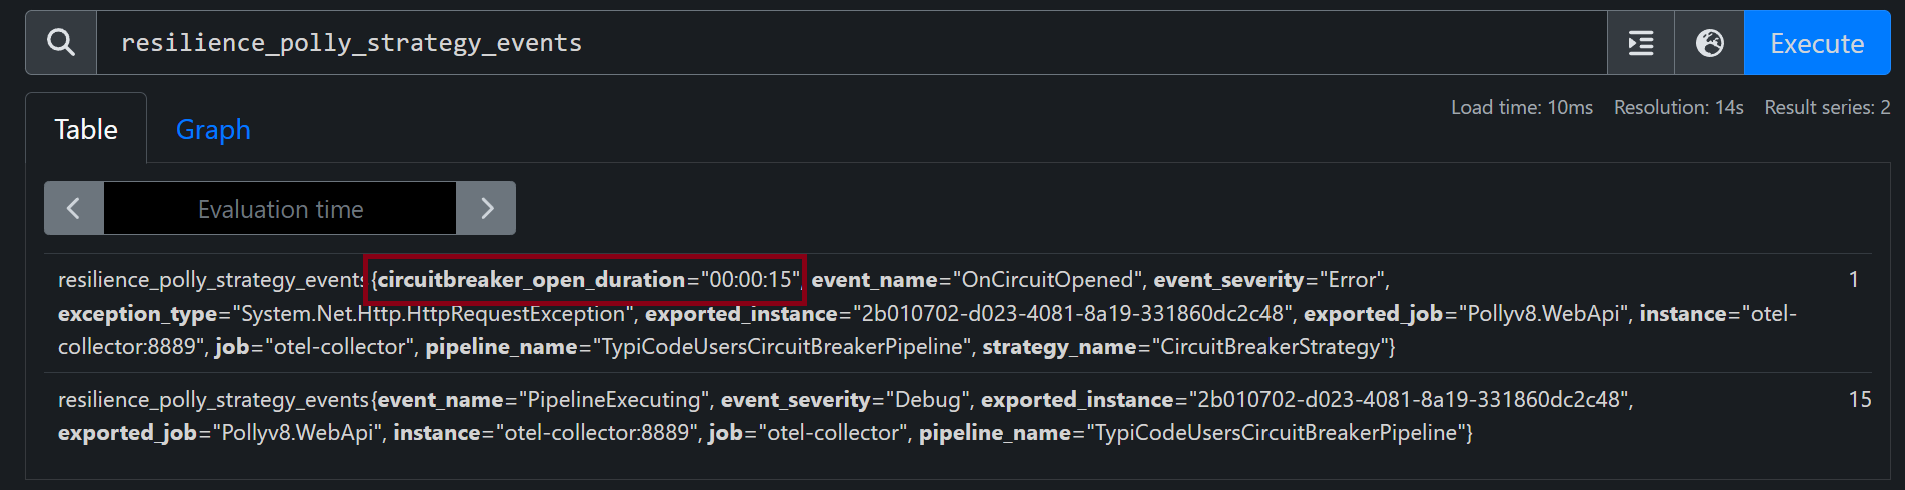
When we configured the Circuit Breaker strategy, do you remember that we added an MeteringEnricher to it?
When the circuit becomes open, this enricher adds a tag that specifies its duration. If we run the .NET API until we force the circuit to open, we can observe in Prometheus how the duration tag is effectively incorporated into the generated metrics.
Grafana
Once we have Polly’s Telemetry in Prometheus, we can start building a dashboard to put these metrics to work.
What can we do with Polly’s Telemetry in Grafana? Let me show you a few examples.
The following Grafana panels are only a few examples of what we can build using the metrics emitted by Polly, we could do more things with them.
- How many calls to the “https://jsonplaceholder.typicode.com/posts/{commentId}/comments" endpoint were retried within the last hour?
sum(resilience_polly_strategy_events{pipeline_name="TypiCodeCommentsRetryPipeline", event_name="OnRetry"})
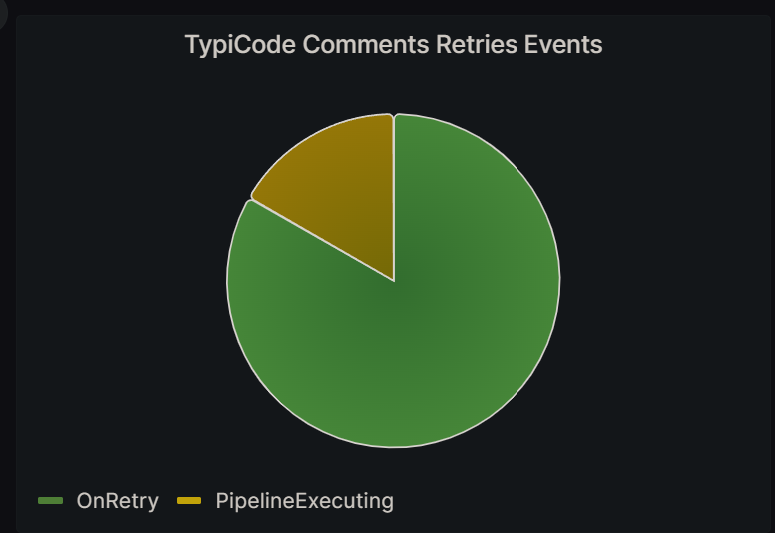
- How many calls to the “https://jsonplaceholder.typicode.com/posts/{commentId}/comments" endpoint were successful? And how many were retried?
sum by(event_name) (resilience_polly_strategy_events{pipeline_name="TypiCodeCommentsRetryPipeline"})
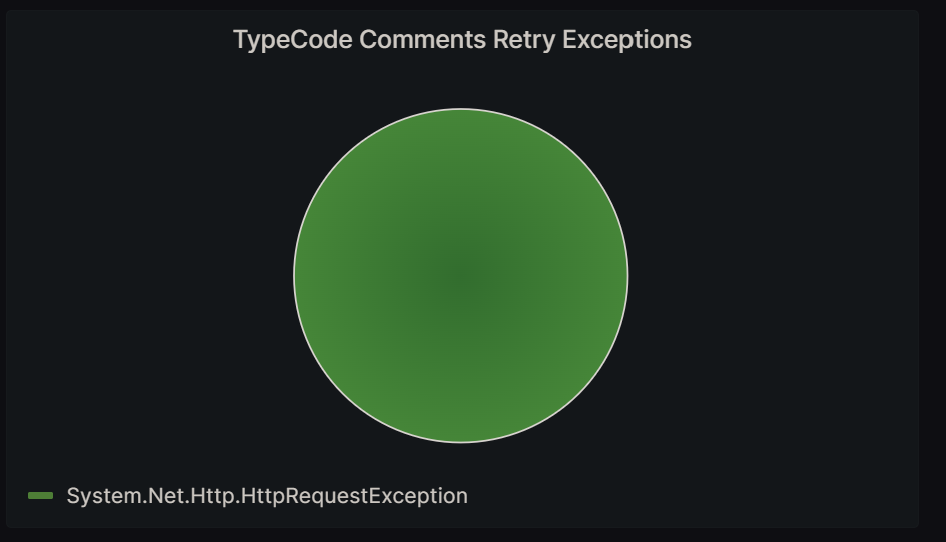
- What types of exceptions were raised during the calls to “https://jsonplaceholder.typicode.com/posts/{commentId}/comments" in each retry?
sum by(exception_type) (resilience_polly_strategy_events{pipeline_name="TypiCodeCommentsRetryPipeline", event_name="OnRetry"})
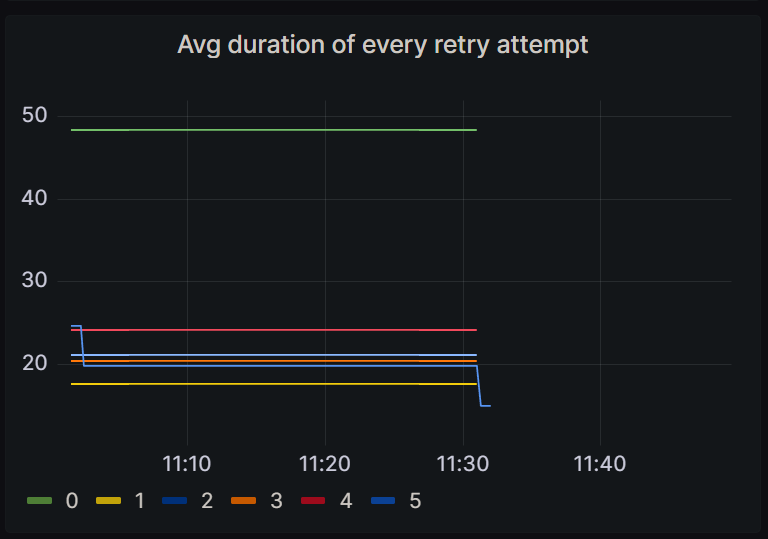
- What is the average duration of each retry made to “https://jsonplaceholder.typicode.com/posts/{commentId}/comments"?
sum by(attempt_number) (rate(resilience_polly_strategy_attempt_duration_sum{pipeline_name="TypiCodeCommentsRetryPipeline"}[30m])) /
sum by(attempt_number) (rate(resilience_polly_strategy_attempt_duration_count{pipeline_name="TypiCodeCommentsRetryPipeline"}[30m]))
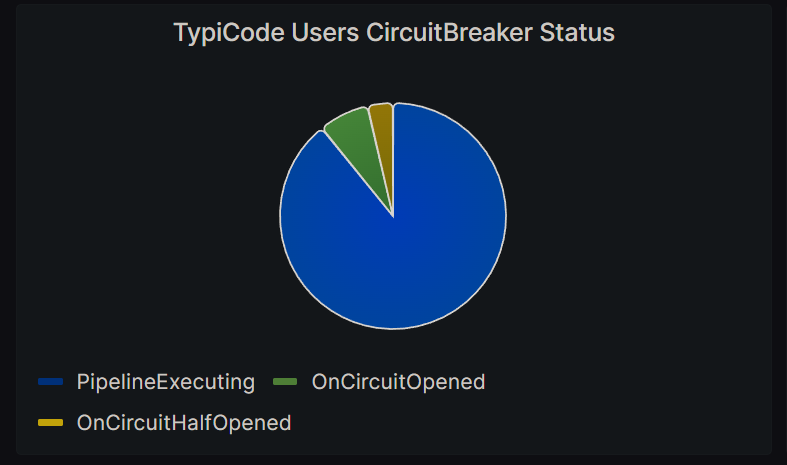
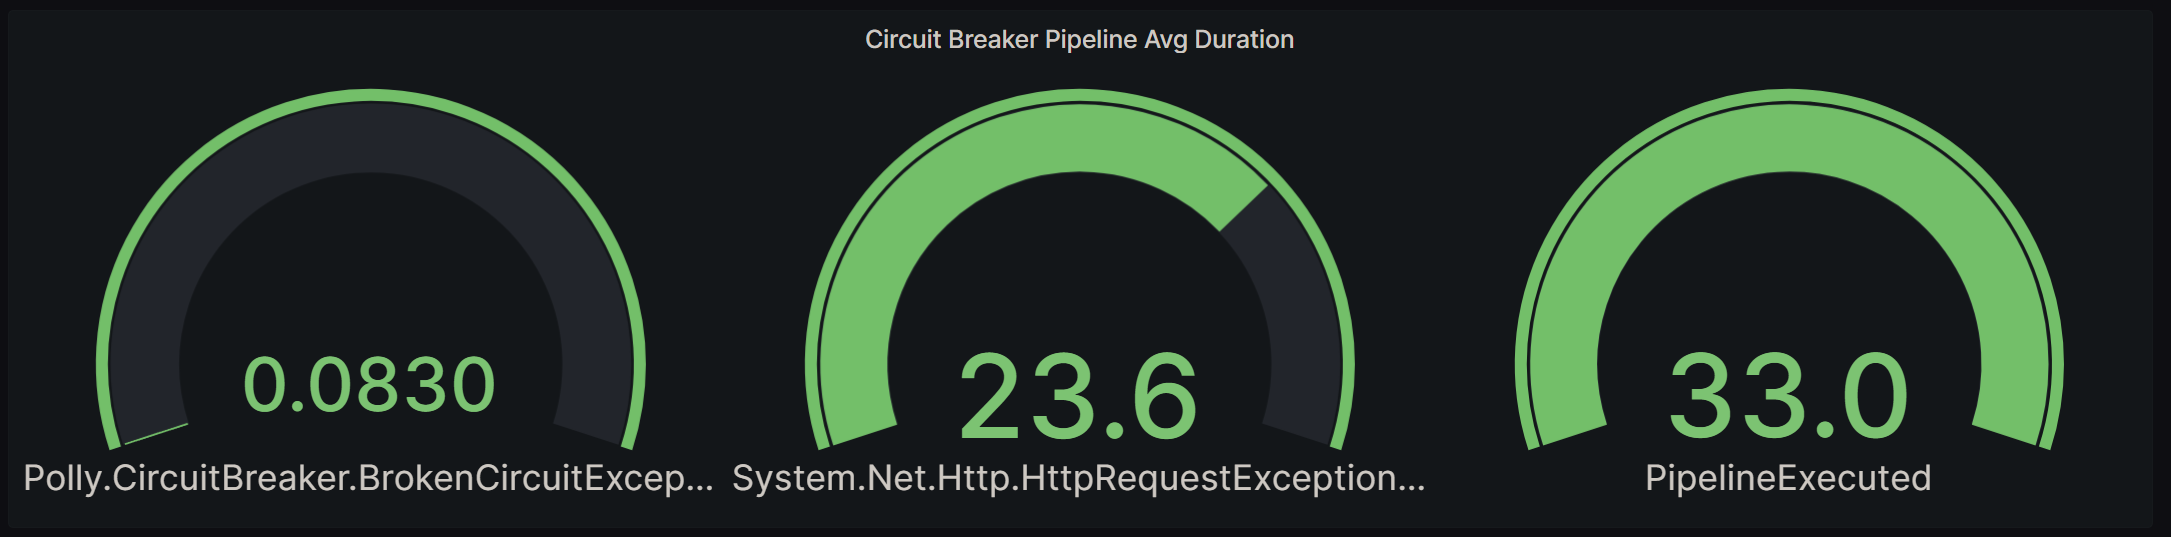
- How many calls were made to the “https://jsonplaceholder.typicode.com/users/{userId}" endpoint when the circuit was open, half open, and closed, respectively?
sum by(event_name) (resilience_polly_strategy_events{pipeline_name="TypiCodeUsersCircuitBreakerPipeline"})
- What is the average response time for each call made to the “https://jsonplaceholder.typicode.com/users/{userId}" endpoint when the circuit is open, and how does it compare to the response time when an error is thrown and the circuit remains closed?
resilience_polly_pipeline_duration_sum{pipeline_name="TypiCodeUsersCircuitBreakerPipeline"} / resilience_polly_pipeline_duration_count{pipeline_name="TypiCodeUsersCircuitBreakerPipeline"}
How to test the Demo Application
If you wish to try out the app on your own, please read this entire section, as there is a caveat to be aware of before you begin testing it.
To access the app’s source code, you can visit my GitHub repository.
If you want to run the app yourself, I have provided a docker-compose file that will launch the app along with its external dependencies.
These external components, including Prometheus, Grafana, and OpenTelemetry Collector, are preconfigured, so you won’t need to perform any additional setup. Simply execute docker-compose up, and you’ll be ready to go!
But, there is a catch to test this app, that you need to be aware of.
Take a look at the docker-compose:
version: '3.8'

networks:
  polly:
    name: polly-network

services:
  prometheus:
    build:
      context: ./scripts/prometheus
    ports:
      - 9090:9090
    networks:
      - polly

  grafana:
    build:
      context: ./scripts/grafana
    depends_on:
      - prometheus
    ports:
      - 3000:3000
    networks:
      - polly

  otel-collector:
    image: otel/opentelemetry-collector:0.73.0
    command: ["--config=/etc/otel-collector-config.yaml"]
    volumes:
      - ./scripts/otel-collector/otel-collector-config.yaml:/etc/otel-collector-config.yaml
    ports:
      - "8888:8888"
      - "8889:8889"
      - "13133:13133"
      - "4317:4317"
    networks:
      - polly

  app:
    build:
      context: ./src/PollyTelemetryDemo.WebApi
    depends_on:
      - otel-collector
    ports:
      - 5001:8080
    environment:
      TypiCodeBaseUri: https://jsonplceholder.typicode.com/
      OtlpEndpointUri: http://otel-collector:4317
    networks:
      - polly
As you can see, the app requires a couple of environment variables to function correctly:
TypiCodeBaseUri: The URI address of the TypiCode API.OtlpEndpointUri: The URI address of the OpenTelemetry Collector
If you examine the value of TypiCodeBaseUri, you’ll notice a typo in the address. The correct address should be jsonplaceholder.typicode.com, but there is a missing ‘a’ in it.
This error is intentional, we want to ensure that calls to TypiCode API fail so that the Polly strategies are executed. This way, we can generate an entire set of Polly metrics.
You can fix the typo and run the docker-compose if you wish, but you won’t see half of the Polly metrics, because some of the Polly strategies, like retries or circuit breaker, are only triggered when something goes wrong.
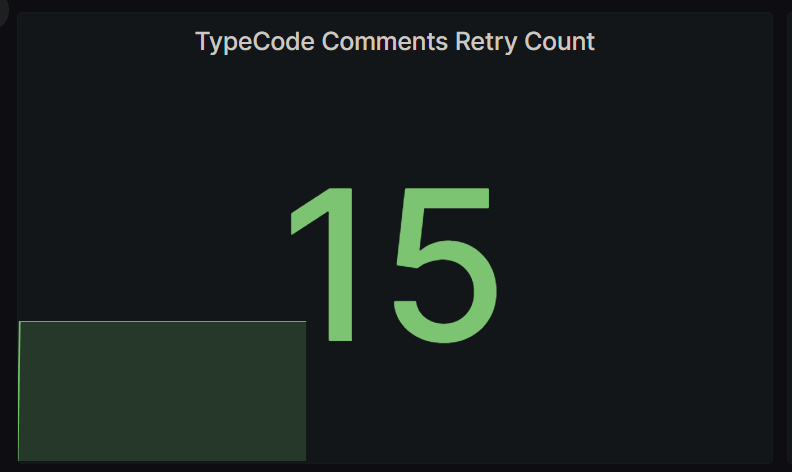
The next image illustrates how the dashboard appears when everything is functioning correctly:
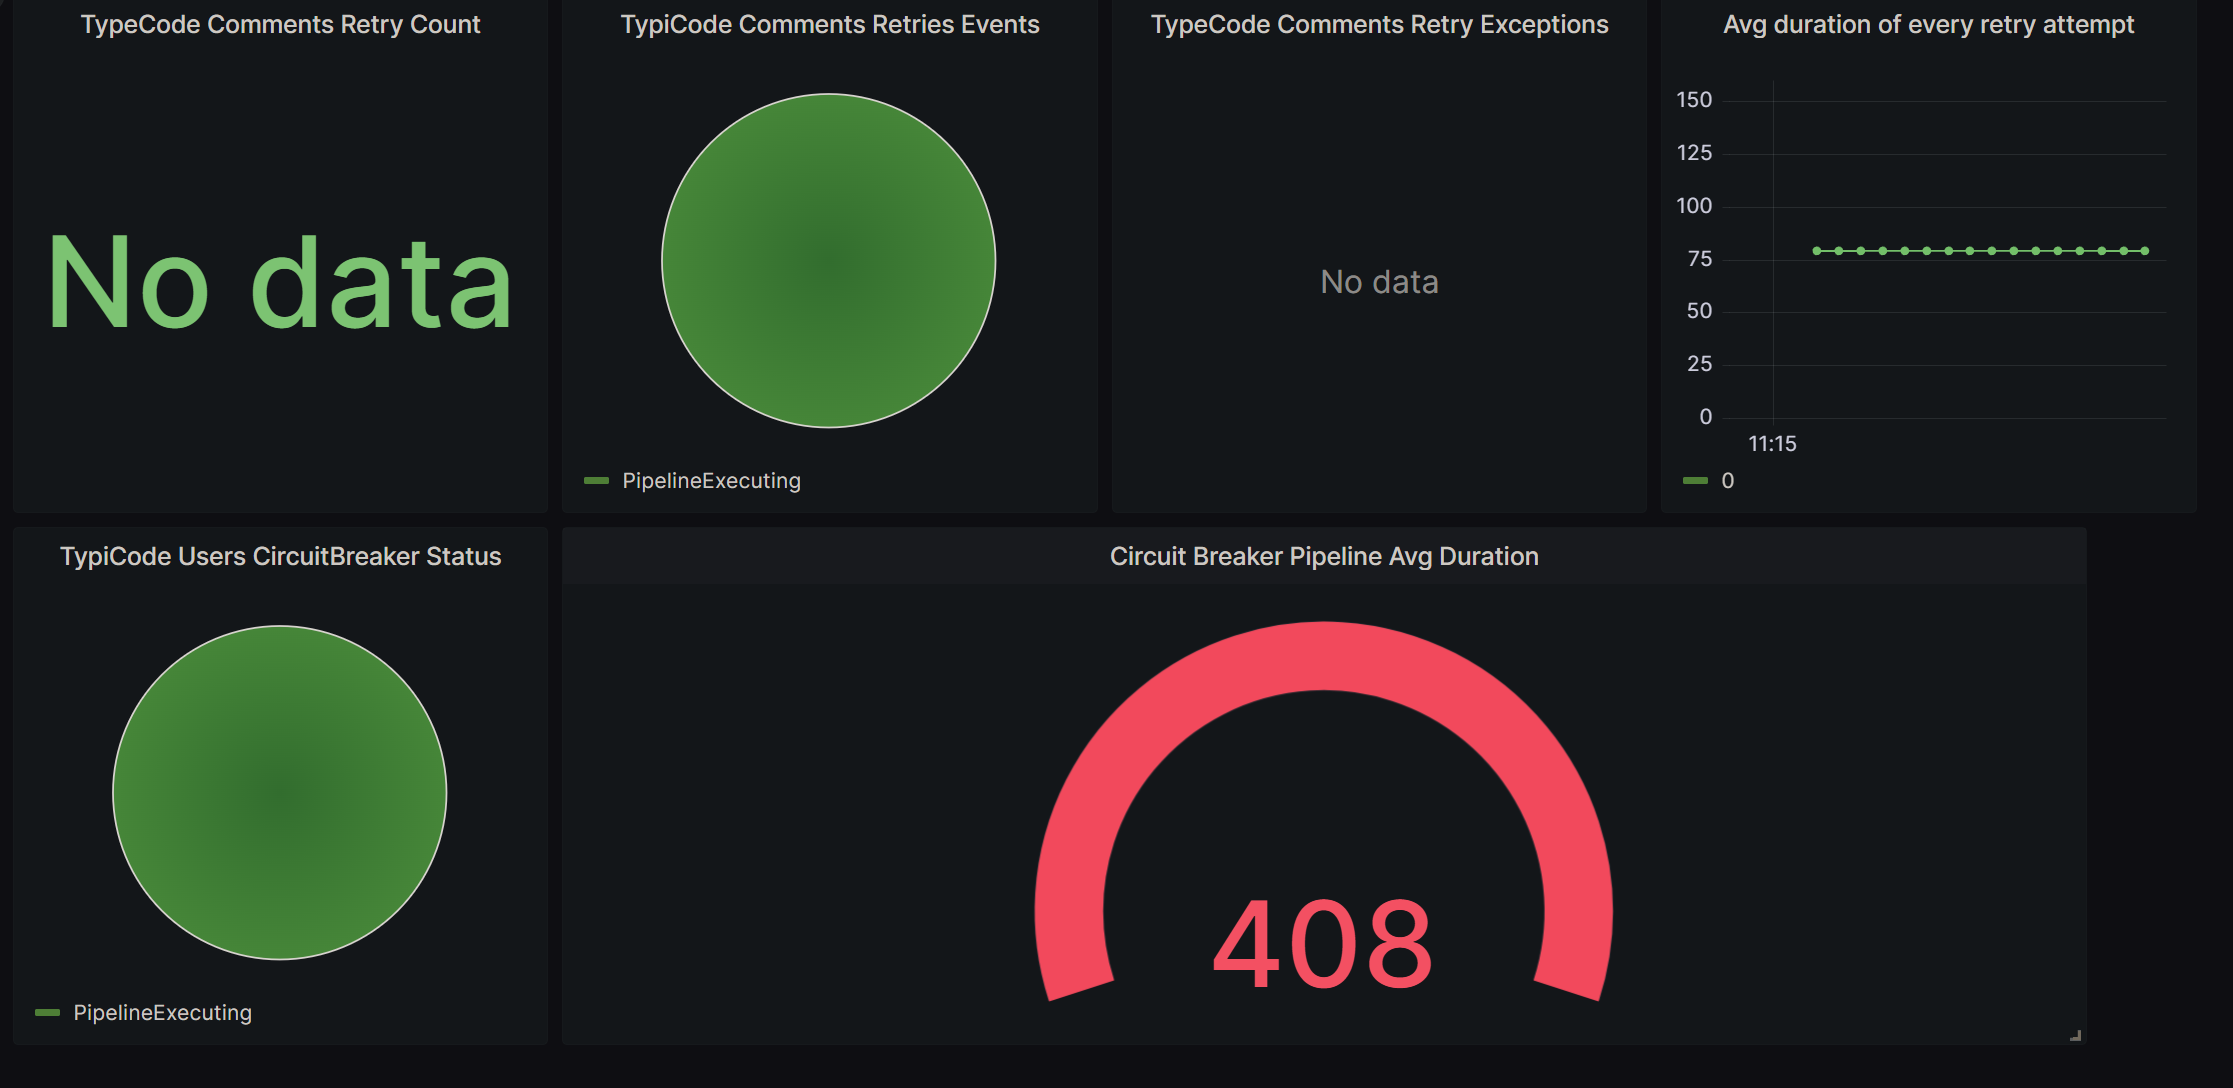
In contrast, this image displays the dashboard’s appearance when HTTP calls to the TypiCode API fail, and the Polly strategies come into play:
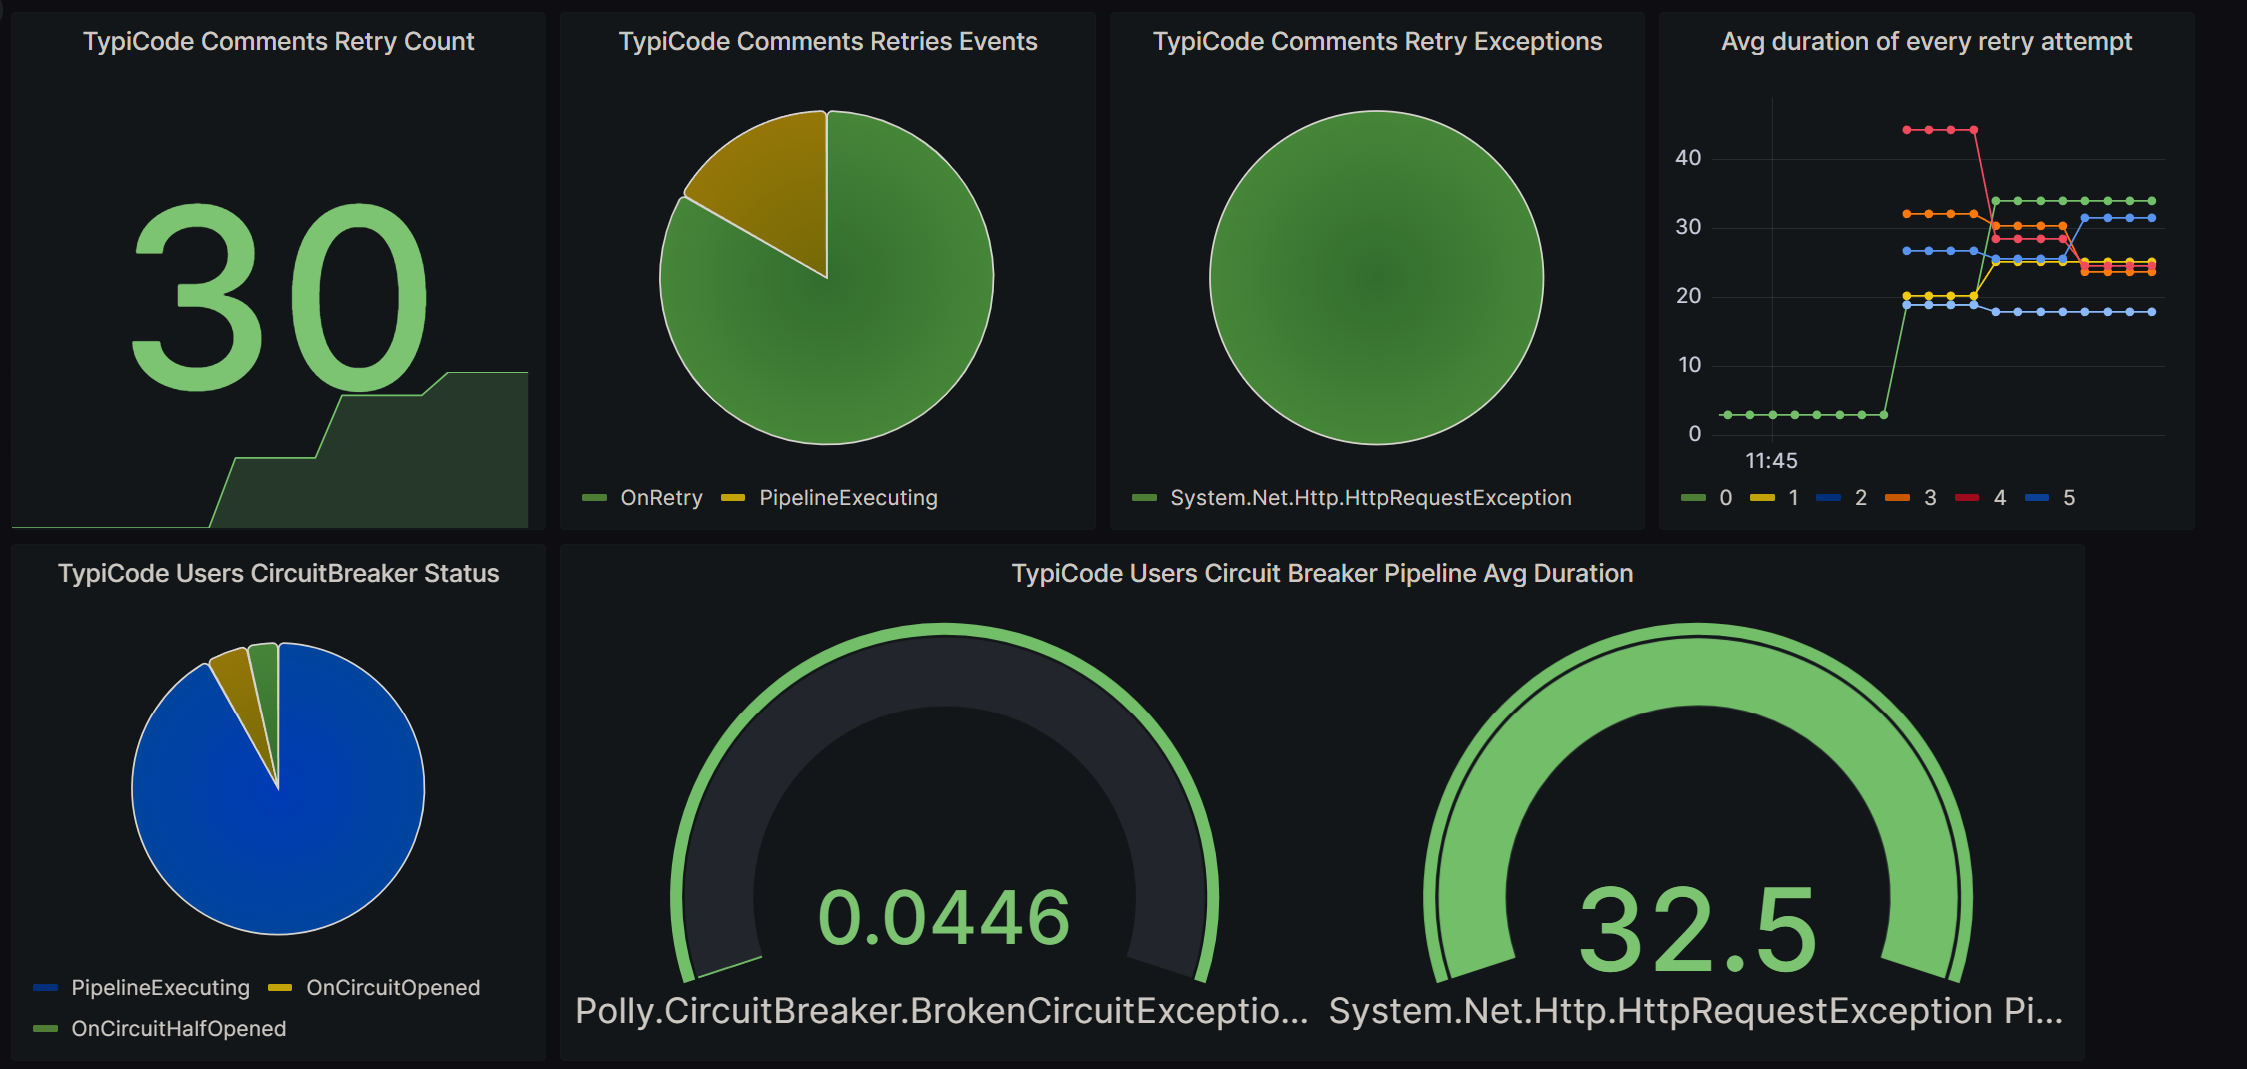
As you can see, when the HTTP call to TypiCode fails, more metrics are generated, resulting in a more compelling dashboard. This explains the typo in the docker-compose file.