Getting started with AWS Distro for OpenTelemetry and distributed tracing using .NET. Part 1: Setting up the AWS OTEL Collector
This is a 2 part-series post.
- Part 1: What is the AWS OpenTelemetry Collector and how to setup it up for ingesting and exporting tracing data to AWS X-Ray.
- Part 2: How to build and configure properly a few distributed .NET apps that will send traces to the AWS OTEL Collector, and also how to analyze those traces in AWS X-Ray.
If you want to read it, click here
Introduction
A few months ago I wrote a post about how to start using OpenTelemetry with .NET, if you’re interested you can read more about it here.
In that post I talked a little bit about the main concepts around OpenTelemetry and also I showed how to instrument a few .NET apps with the .NET OpenTelemetry client.
In this post I’m going to get back to OpenTelemetry and .NET, but this time I’m planning to focus on trying out the AWS Distro for OpenTelemetry.
I’m not going to repeat myself talking about what’s an Activity or a Span or a Propagator, you can go read my other post.
I’m sure there’s going to be some overlap with my previous post, but I’ll try it to keep it to a minimum.
In this 2 part-series post I’m planning to be talking about the following topics:
- What is the AWS OpenTelemetry Collector and how to setup it up for ingesting and exporting traces to AWS X-Ray.
- How to build and configure properly a few distributed .NET apps that will send traces to the AWS OTEL Collector.
- How to use AWS X-Ray to view the traces sent by the Collector.
But first of all:
- What’s the AWS Distro for OpenTelemetry?
The AWS Distro for OpenTelemetry is an AWS-supported distribution of the OpenTelemetry project.
With the AWS Distro for OpenTelemetry you can instrument your application to send metrics and traces to multiple AWS solutions such as AWS CloudWatch, Amazon Managed Service for Prometheus, AWS X-Ray or Amazon OpenSearch Service.
It can also collect metadata from your AWS resources and managed services, so you can correlate application data with infrastructure data.
The main component of the AWS Distro for OpenTelemetry is the AWS OpenTelemetry Collector which is capable of ingesting metrics and traces sent by the apps, process them and export them into multiple AWS solutions.
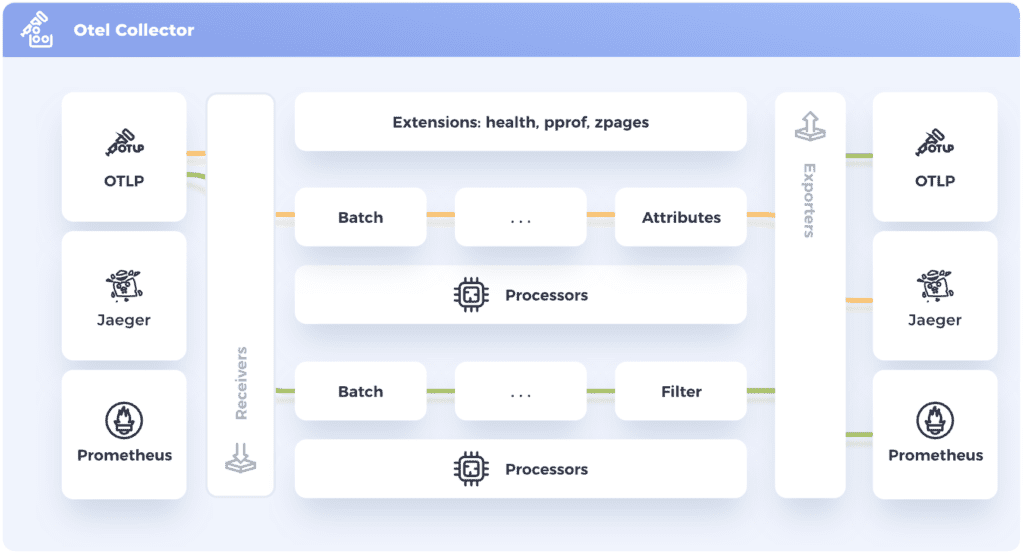
AWS OpenTelemetry Collector
The OpenTelemetry Collector is a standalone process designed to receive, process and export telemetry data.
It removes the need to run, operate and maintain multiple agents/collectors in order to support open-source telemetry data formats (e.g. Jaeger, Prometheus, Zipkin, etc.) sending to multiple open-source or commercial back-ends.
The Collector has two different deployment strategies: either running as an agent alongside a service, or as a remote application.
In general, using both is recommended: the agent would be deployed with your service and run as a sidecar; meanwhile, the remote app would be deployed separately, as its own application running in a container or virtual machine.
Here’s a diagram showing the collector architecture:
Apart from traces, the AWS OTEL Collector is capable of ingesting metrics and send them to AWS Cloudwatch Metrics, but in this post I’ll be focusing solely on tracing data.
It’s worth mentioning that there are 2 Collectors: the “official” OpenTelemetry Collector and the AWS OpenTelemtry Collector.
AWS instead of using directly the “official” OpenTelemetry Collector has decided to implement their own Collector.
The AWS OTEL Collector is built on top of the “official” OpenTelemetry Collector but they have added AWS-specific exporters to send data to AWS services including AWS X-Ray, Amazon CloudWatch or Amazon Managed Service for Prometheus.
In this post series we are not going to use the “official” OpenTelemetry Collector, instead of that we will be using the AWS OpenTelemetry Collector.
I could use the “oficial” OpenTelemetry Collector with the AWS exporters and it would work, but using the AWS one is simpler and faster to setup, so I decided to ran with it.
Configuring the AWS OpenTelemetry Collector
If you want to configure it, you need to know that the configuration contains three main components:
- Receivers: They can be push or pull based and is how data gets into the Collector.
- Exporters: They can be push or pull based and is how you send data to one or more backends/destinations.
- Processors: They run on the data between being received and being exported. Processors are optional.
In our demo the apps will be sending traces to the Collector and the Collector will export them into X-Ray.
To build the demo we are going need the following receivers, exporters and processors:
- Receivers:
- OTEL gRPC Receiver: The .NET apps will send the tracing data to the OTLP gRPC receiver endpoint. This receiver receives data via gRPC using the OTLP format.
We could use the OTEL HTTP receiver, but the gRPC one is more performant. The HTTP receiver receives data via HTTP in JSON format.
- OTEL gRPC Receiver: The .NET apps will send the tracing data to the OTLP gRPC receiver endpoint. This receiver receives data via gRPC using the OTLP format.
- Exporters:
- X-Ray Exporter: This exporter converts the AWS X-Ray OTLP formatted trace data to the AWS X-Ray format and then exports this data to the AWS X-Ray service.
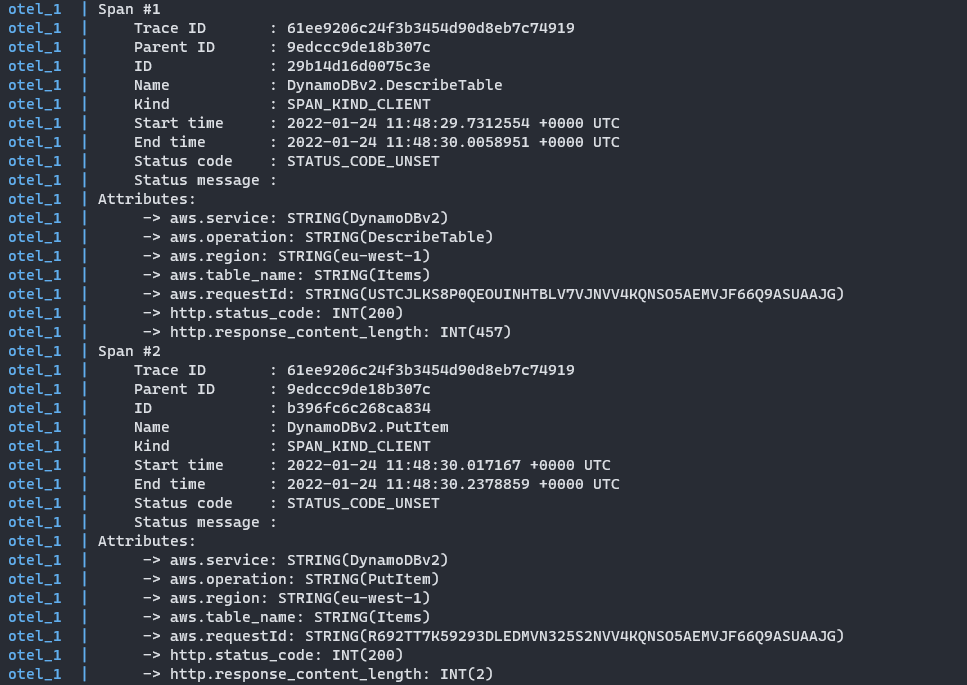
- Logging Exporter: This exporter writes the OTLP traces to console. This exporter is not needed, but it’s quite useful for reviewing what data are the apps sending to the Collector.
- Processors:
- Memory limiter Processor: This processor ensures that the Collector does not goes crazy using memory.
This processor is really useful if you deploy the Collector as a sidecar along your application, because it will ensure that the Collector does not use up memory needed by your application. - Batch Processor: This processor accepts spans, metrics, or logs and places them into batches. Batching helps better compress the data and reduce the number of outgoing connections required to transmit the data.
- Memory limiter Processor: This processor ensures that the Collector does not goes crazy using memory.
If you’re curious about the logging exporter, here’s an example of how the output looks like:
And here’s how we’re going to configure the Collector:
receivers:
  otlp:
    protocols:
      grpc:
        endpoint: 0.0.0.0:4317

processors:
  memory_limiter:
    limit_mib: 50
    check_interval: 1s
  batch/traces:
    timeout: 1s
    send_batch_size: 50

exporters:
  logging:
    loglevel: debug
  awsxray:
    region: eu-west-1

service:
  pipelines:
    traces:
      receivers:
        - otlp
      processors:
        - memory_limiter
        - batch/traces
      exporters:
        - logging
        - awsxray
Configuring permissions for the AWS OpenTelemetry Collector
- All the AWS Access Keys and Secret Keys from this post are fake, so don’t bother trying them out.
I’ll be running the Collector on my local machine using docker-compose, that requires that you specify a valid AWS_ACCESS_KEY and AWS_SECRET_ACCESS_KEY.
Here’s a snippet from the docker-compose file where the Collector is configured:
  otel:
    image: amazon/aws-otel-collector:latest
    command: --config /config/config.yml
    volumes:
      - ./aws-otel-collector-config:/config
    environment:
      - AWS_ACCESS_KEY_ID=AKIA5S6L5S6L5S6L5S6L
      - AWS_SECRET_ACCESS_KEY=GO7BvT9IBLb4NudL0aGO7BvT9IBLb4NudL0a
      - AWS_REGION=eu-west-1
    ports:
      - 4317:4317
    networks:
      - tracing
The user requires at least permissions for AWS CloudWatch Logs for metric publishing, and for AWS X-Ray for sending traces.
So, I’ll be using this IAM policy for the Collector:
Copy
{
    "Version": "2012-10-17",
    "Statement": [
        {
            "Effect": "Allow",
            "Action": [
                "logs:PutLogEvents",
                "logs:CreateLogGroup",
                "logs:CreateLogStream",
                "logs:DescribeLogStreams",
                "logs:DescribeLogGroups",
                "xray:*",
                "ssm:GetParameters"
            ],
            "Resource": "*"
        }
    ]
}
After setting up the AWS OTEL Collector, I’m ready to begin building the apps, but it won’t be right now.
See you in part 2