Code Coverage in .NET
Nowadays, if we want to collect Code Coverage in our .NET applications, tools like Coverlet, Report Generator, dotnet-coverage, dotCover, OpenCover or even Visual Studio will surely sound familiar to you.
If we want to track how our application’s Code Coverage evolves over time, there are excellent SaaS products like SonarQube or CodeCov.
For those using CI runners like Azure Pipelines or GitHub Actions, you can even upload a Code Coverage report into a pipeline summary, which is useful for quickly checking the Code Coverage value of a specific run.
I believe it would be useful to briefly explore all the tools and services mentioned above, as they can provide us with a clearer understanding of the current landscape for collecting Code Coverage in .NET.
But before we delve into that, allow me to briefly explain what Code Coverage is.
What is Code Coverage?
Code Coverage is a metric that can help you understand how much of your source code is tested. It’s a metric that can help you assess the quality of your test suite.
Code Coverage is primarily performed at the unit testing level. Code Coverage tools usually express the metric as a percentage, showing you the percentage of successfully validated lines of code in your test procedures, helping you to understand how thoroughly you’re testing your code.
The importance of code coverage lies in its ability to identify uncovered code that has not been tested and could contain bugs or potential issues not addressed by the test suite.
It’s important to note that while code coverage is a valuable metric, achieving 100% coverage does NOT guarantee a bug-free application.
It is just one of many tools and practices in a developer’s toolkit for ensuring software and code quality.
Code Coverage Tools
There are two types of Code Coverage tools:
- Data Collectors: These tools monitor test executions and gather information about test runs. They report the collected data in various output formats, such as XML and JSON.
- Report generators: These tools utilize the data collected by the Data Collectors to generate comprehensive reports.
Let’s first take a look at the most well-known DataCollectors, and then we’ll delve into the Report Generators.
The Data Collector tools we’re going to discuss include:
- .NET native Code Collector
- Coverlet
- dotCover
- dotnet-coverage
- openCover
The Report Generator tool we’re going to explore in this post is:
- ReportGenerator
.NET built-in Data Collector
.NET includes a built-in Code Coverage data collector. To use it, you can use the .NET CLI and run dotnet test --collect:"Code Coverage" command.
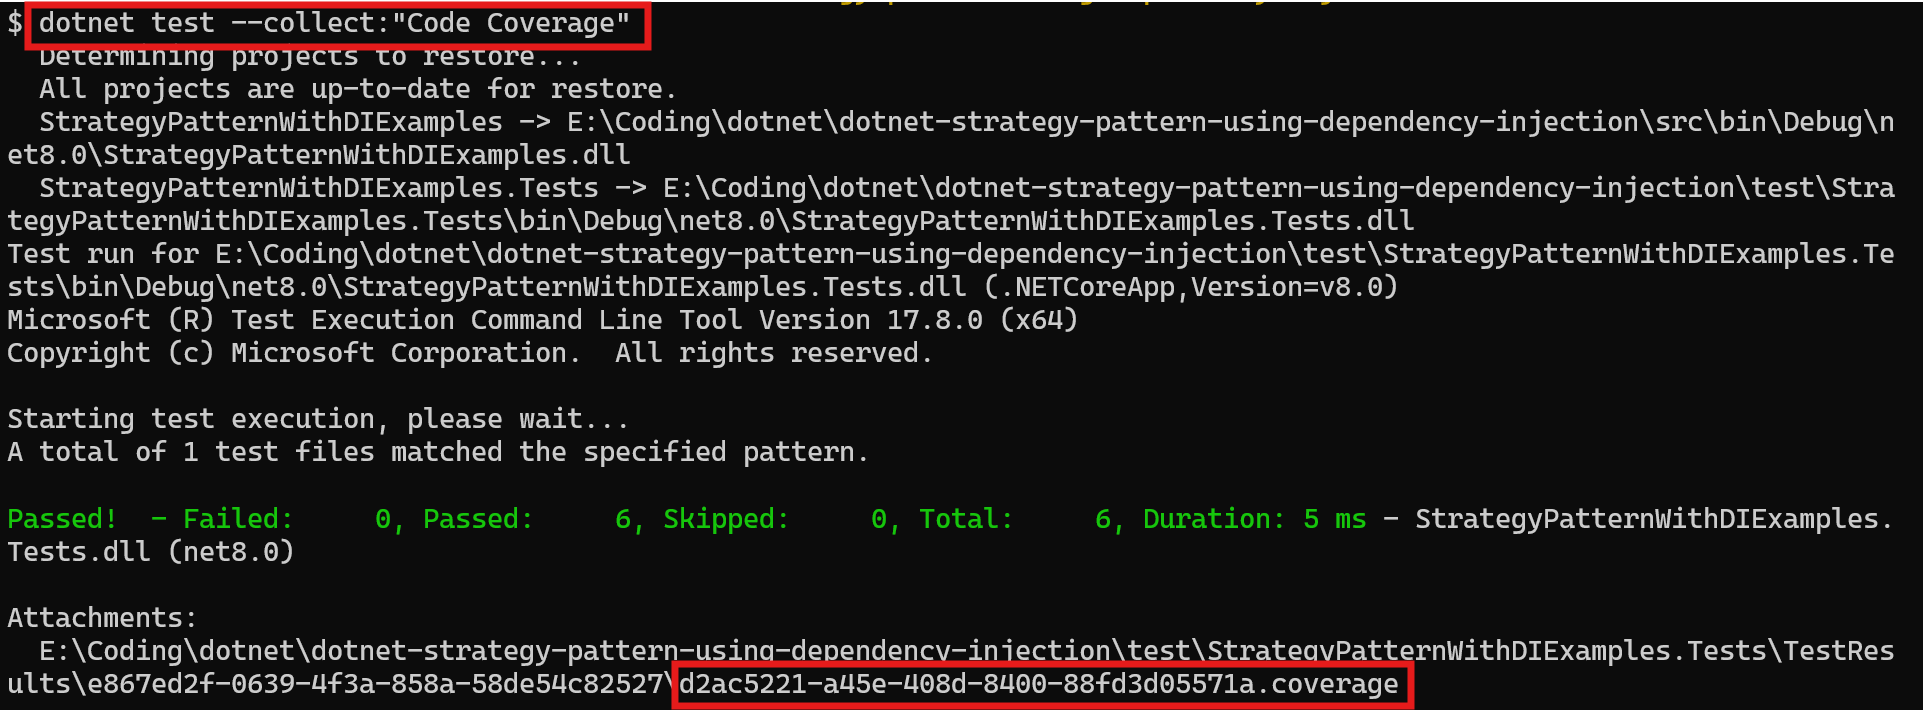
Collecting Code Coverage in this manner is a common error, as by default, this Data Collector analyzes all solution assemblies loaded during unit tests. This means that the Unit Test projects will be included in the report, thereby skewing the average Code Coverage percentage.
To generate an accurate Code Coverage report, it’s necessary to exclude test projects from the code coverage results and only include application code. You have two options to achieve this:
- Option 1: Add the
ExcludeFromCodeCoverageAttributeattribute on your tests projects, as shown below:
<ItemGroup>
  <AssemblyAttribute Include="System.Diagnostics.CodeAnalysis.ExcludeFromCodeCoverageAttribute" />
</ItemGroup>
- Option 2: Create a
.runsettingsfile that excludes the Unit Test projects from Code Coverage and run thedotnet testcommand using the--settingsattribute.
Here’s an example:dotnet test --collect:"Code Coverage" --settings codeCoverage.runsettings
The following code snippet shows a .runsettings file where all the projects named *Tests are excluded from the Code Coverage report.
<?xml version="1.0" encoding="utf-8" ?>
<RunSettings>
  <DataCollectionRunSettings>
    <DataCollectors>
      <DataCollector friendlyName="Code Coverage" uri="datacollector://Microsoft/CodeCoverage/2.0" assemblyQualifiedName="Microsoft.VisualStudio.Coverage.DynamicCoverageDataCollector, Microsoft.VisualStudio.TraceCollector, Version=11.0.0.0, Culture=neutral, PublicKeyToken=b03f5f7f11d50a3a">
        <Configuration>
          <CodeCoverage>
            <ModulePaths>
              <Exclude>
                <ModulePath>.*Tests.dll</ModulePath>
              </Exclude>
            </ModulePaths>
            <UseVerifiableInstrumentation>True</UseVerifiableInstrumentation>
            <AllowLowIntegrityProcesses>True</AllowLowIntegrityProcesses>
            <CollectFromChildProcesses>True</CollectFromChildProcesses>
            <CollectAspDotNet>False</CollectAspDotNet>
            <EnableStaticNativeInstrumentation>True</EnableStaticNativeInstrumentation>
            <EnableDynamicNativeInstrumentation>True</EnableDynamicNativeInstrumentation>
            <EnableStaticNativeInstrumentationRestore>True</EnableStaticNativeInstrumentationRestore>
          </CodeCoverage>
        </Configuration>
      </DataCollector>
    </DataCollectors>
  </DataCollectionRunSettings>
</RunSettings>
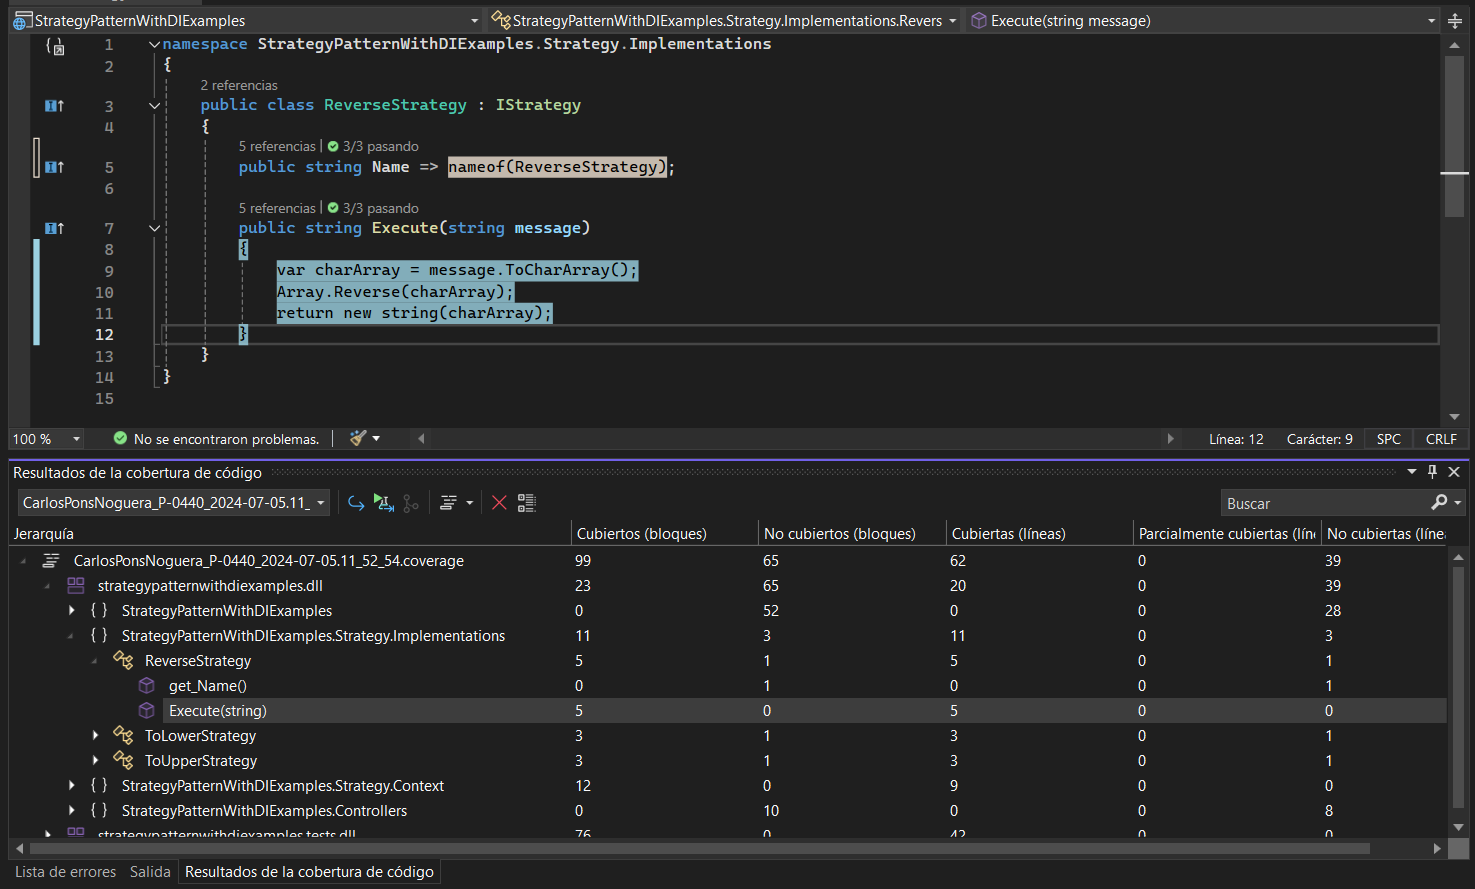
Once the Data Collector has completed its data collection, it generates a report in a binary .coverage file. This file is not human-readable. So, what can we do with it? It can be utilized to generate reports in Visual Studio.
Here’s how it appears when we open the resulting .coverage file with Visual Studio.
To open the
.coveragefiles with Visual Studio, you will need Visual Studio Enterprise Edition.
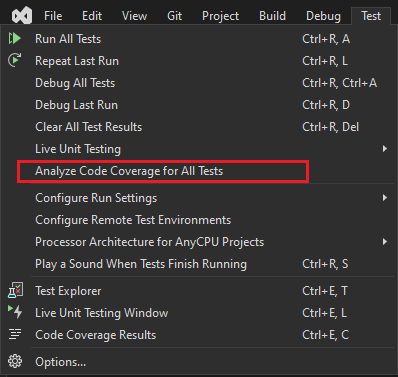
Another option to collect Code Coverage using the .NET built-in collector, apart from the .NET CLI, is to directly use Visual Studio.
To collect Code Coverage using Visual Studio, you will also need Visual Studio Enterprise edition.
Simply select the Test > Analyze Code Coverage for All Tests option.
Coverlet
Coverlet is an alternative to the built-in Data Collector we discussed earlier. It generates test results in the form of Cobertura XML files, which can then be used to create HTML reports.
In fact, it is the most widely used and well-known Code Coverage Data Collector. Evidence of this is that the official .NET xUnit test project template comes with Coverlet already integrated.
Give it a try. Create a new xUnit project using the .NET CLI command: dotnet new xunit, and then inspect the resulting .csproj. You’ll see that the Coverlet NuGet package is already installed in the project.
<Project Sdk="Microsoft.NET.Sdk">

  <PropertyGroup>
    <TargetFramework>net8.0</TargetFramework>
    <ImplicitUsings>enable</ImplicitUsings>
    <Nullable>enable</Nullable>

    <IsPackable>false</IsPackable>
    <IsTestProject>true</IsTestProject>
  </PropertyGroup>

  <ItemGroup>
    <PackageReference Include="Microsoft.NET.Test.Sdk" Version="17.6.0" />
    <PackageReference Include="xunit" Version="2.4.2" />
    <PackageReference Include="xunit.runner.visualstudio" Version="2.4.5">
      <IncludeAssets>runtime; build; native; contentfiles; analyzers; buildtransitive</IncludeAssets>
      <PrivateAssets>all</PrivateAssets>
    </PackageReference>
    <PackageReference Include="coverlet.collector" Version="6.0.0">
      <IncludeAssets>runtime; build; native; contentfiles; analyzers; buildtransitive</IncludeAssets>
      <PrivateAssets>all</PrivateAssets>
    </PackageReference>
  </ItemGroup>

</Project>
Once the Coverlet package is installed in the Unit Test project, you can start collecting Code Coverage using the dotnet test --collect:"XPlat Code Coverage" command.
The Data Collector will generate a Cobertura XML file. The XML Cobertura format is frequently used as a standard format for Code Coverage reports.
If you attempt to run the dotnet test --collect:"XPlat Code Coverage" command without having the Coverlet.Collector package installed on your Unit Tests projects, no Code Coverage will be collected and you’ll receive a warning.
Data collection : Unable to find a datacollector with friendly name 'XPlat Code Coverage'.
Data collection : Could not find data collector 'XPlat Code Coverage'
The output format of the Code Coverage report can be changed using the Format parameter. The supported formats are lcov, opencover, cobertura, teamcity and json.
Here’s an example:
dotnet test --collect:"XPlat Code Coverage;Format=json"
Moreover, it’s even possible to specify the coverage output in multiple formats.
dotnet test --collect:"XPlat Code Coverage;Format=json,cobertura"
dotCover
dotCover is a .NET Code Coverage tool (among other features) developed by Jetbrains. It integrates with Visual Studio (if you have a JetBrains license), but it is also available as a free .NET CLI global tool.
You can install it using the following .NET CLI command:
dotnet tool install --global JetBrains.dotCover.CommandLineTools
One advantage of dotCover over the previously discussed Data Collectors is its ability to generate a human-readable report right away.
With Coverlet or the .NET native collector, you initially get a Code Coverage report in Cobertura XML format, JSON or Coverage file, and you need a secondary tool to make it human-readable (Visual Studio, report generator tool, etc).
To collect Code Coverage with dotCover, run the following command:
dotnet dotcover cover-dotnet --output=coverage.html --reporttype=HTML -- test ./test/StrategyPatternWithDIExamples.Tests/StrategyPatternWithDIExamples.Tests.csproj
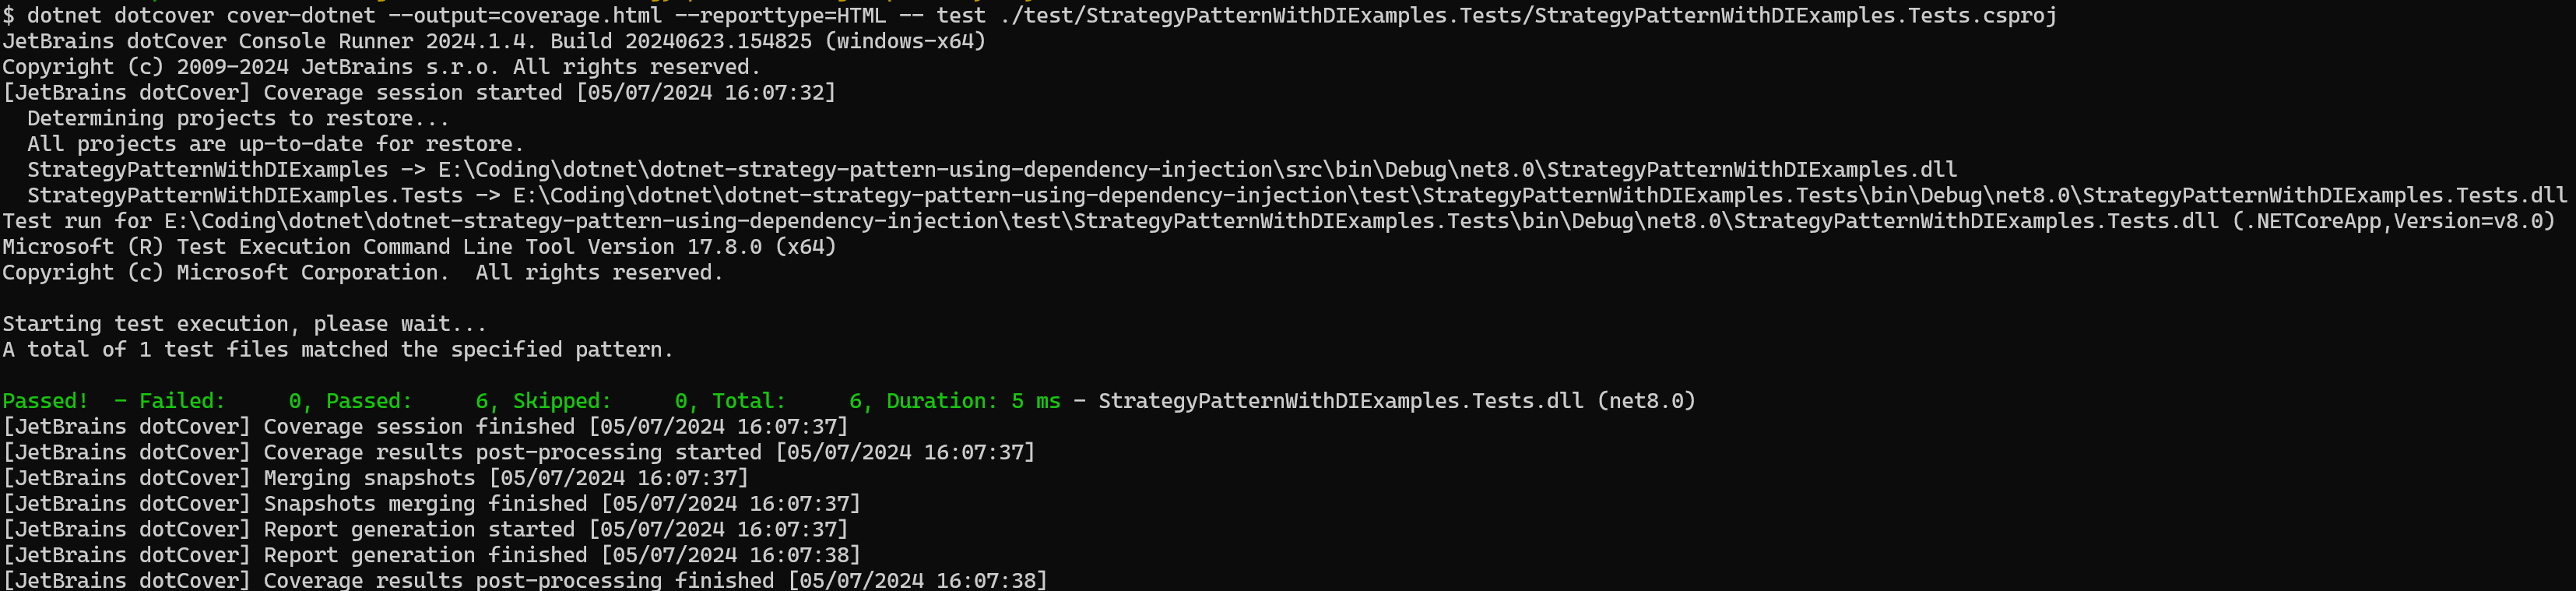
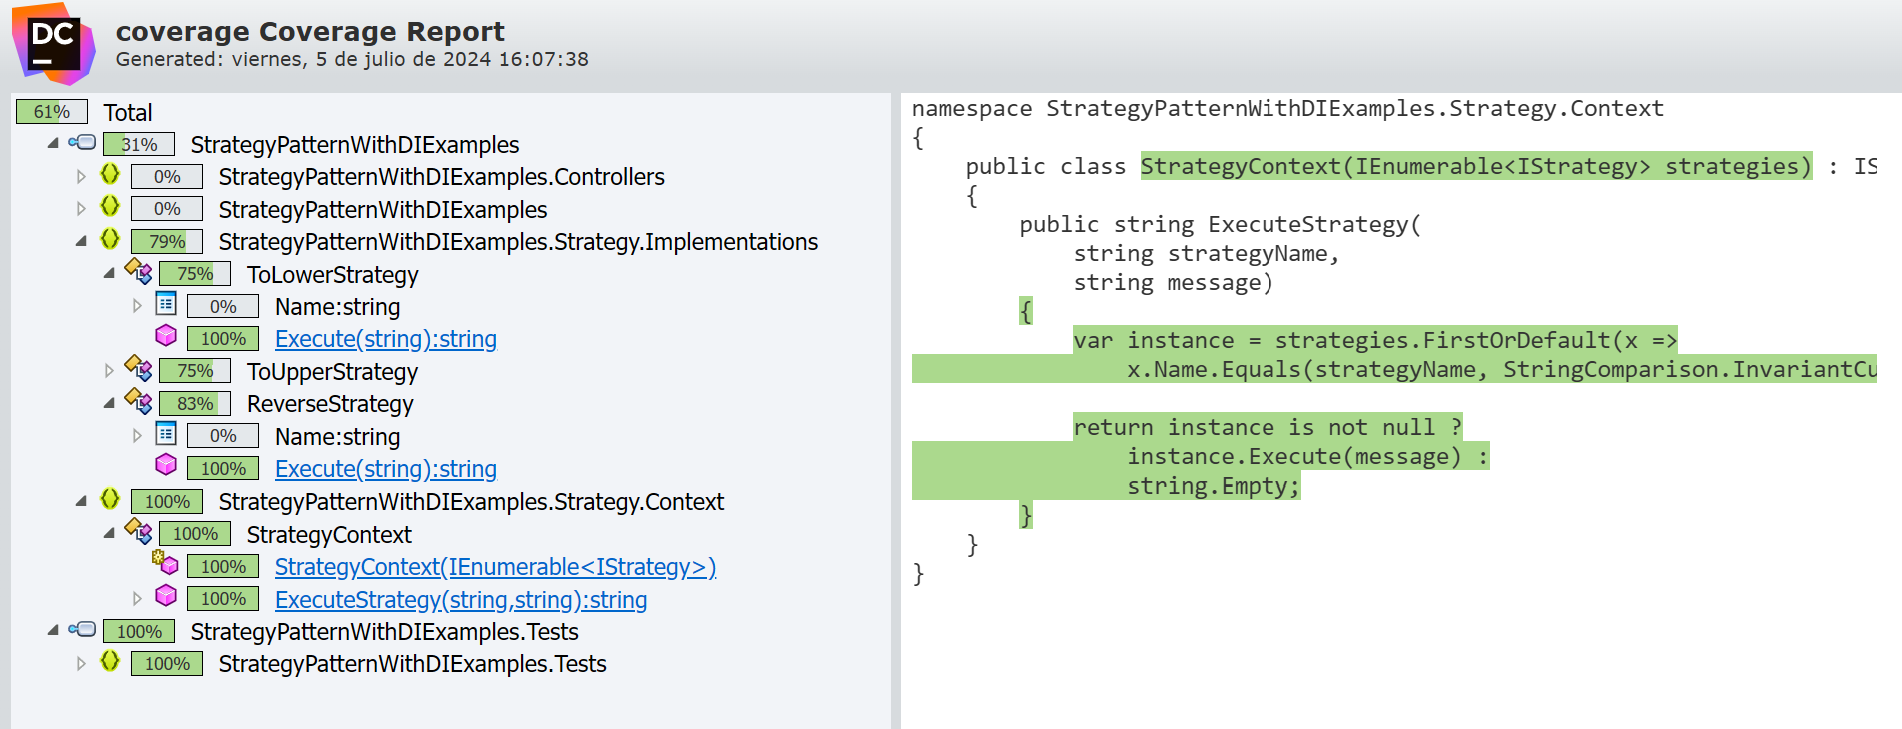
With the reporttype option, we set the Code Coverage report to HTML. So, once the command has finished, a comprehensive HTML coverage report will be created for us.
dotCover is capable of creating the coverage report in other formats apart from HTML, such as JSON, XML, DetailedXML, NDependXML, SummaryXML, FileCoverageXML, and FileCoverageJson.
The following screenshot shows an example of the generated Code Coverage HTML report.
dotnet-coverage
The dotnet-coverage tool is a cross-platform tool capable of collecting Code Coverage data.
To install it, use the dotnet tool install command:
dotnet tool install --global dotnet-coverage
To collect Code Coverage from your tests, simply run the command:
dotnet-coverage collect dotnet test -f cobertura -o coverage.xml.
The -o option sets the Code Coverage report output file and the -f option sets the output file format. Supported formats include coverage, xml, and cobertura.
Another useful feature of this tool is its ability to convert from one coverage report format to another.
For example, you can convert a .coverage file to a cobertura XML file simply by running the command:
dotnet-coverage merge -f cobertura -o cobertura.xml 61935778-bdd8-4758-959c-94fdd6a8a376.coverage
This can be handy if you have some Code Coverage reports collected using Visual Studio and want to convert them into a more standard format.
OpenCover
OpenCover is yet another Code Coverage tool for the .NET Framework.
However, development for this tool has ceased, and it is no longer maintained. Therefore, I will skip its analysis, as it is advisable to use one of the other tools we have discussed in this post.
Generate reports
In the previous sections, we have covered several Code Coverage Data Collectors that can gather Code Coverage data from unit test runs.
With the exception of dotCover, which is capable of generating an HTML report from the get-go, the collected Code Coverage data is not human-friendly.
Now, it is time to convert the Code Coverage reports into a human-readable format. For this purpose, we will use the ReportGenerator tool. This tool can convert multiple Code Coverage formats (Coverlet, OpenCover, dotCover, Visual Studio, NCover, Cobertura, gcov, lcov, among others) into a readable report.
To install the ReportGenerator as a .NET global tool, use the following command:
dotnet tool install -g dotnet-reportgenerator-globaltool
Now, let’s try to generate a report using the Code Coverage data collected with the tools we’ve covered in the previous sections.
Generate a report from a .coverage file
If we try to generate a report from a .coverage file using ReportGenerator, it won’t work.
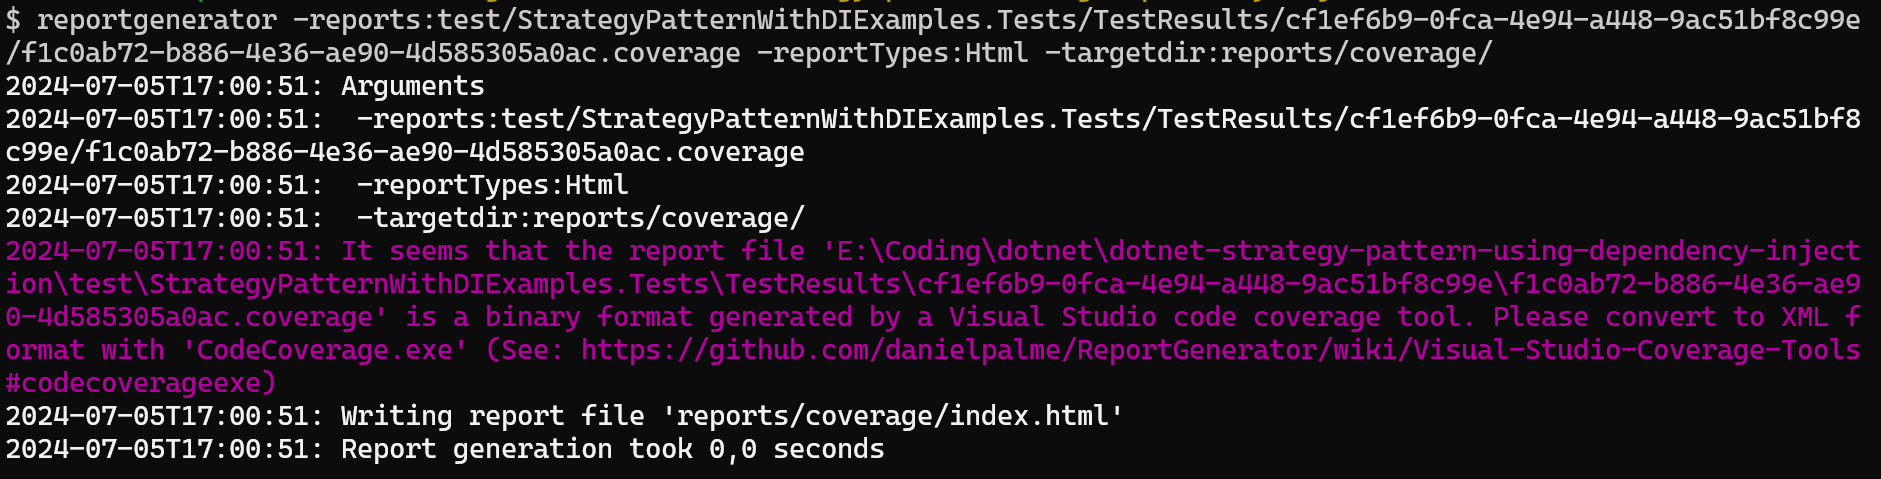
We need to convert the .coverage file to another format first. If you follow the help link shown in the error, it suggest converting it using the vstest.console.exe application, which comes with Visual Studio.
However, this process is not very user-friendly. You’ll need to locate the executable in your Visual Studio installation folder, and it only works on Windows, making it a less-than-ideal solution.
A much easier way to convert it is to use the merge command from the dotnet-coverage tool, like this:
dotnet-coverage merge -f xml -o coverage.xml test/StrategyPatternWithDIExamples.Tests/TestResults/da55597e-25e5-4272-a01f-4ce1ef0f84da/108ca3fa-2cc0-4550-a50e-00d9090ab200.coverage
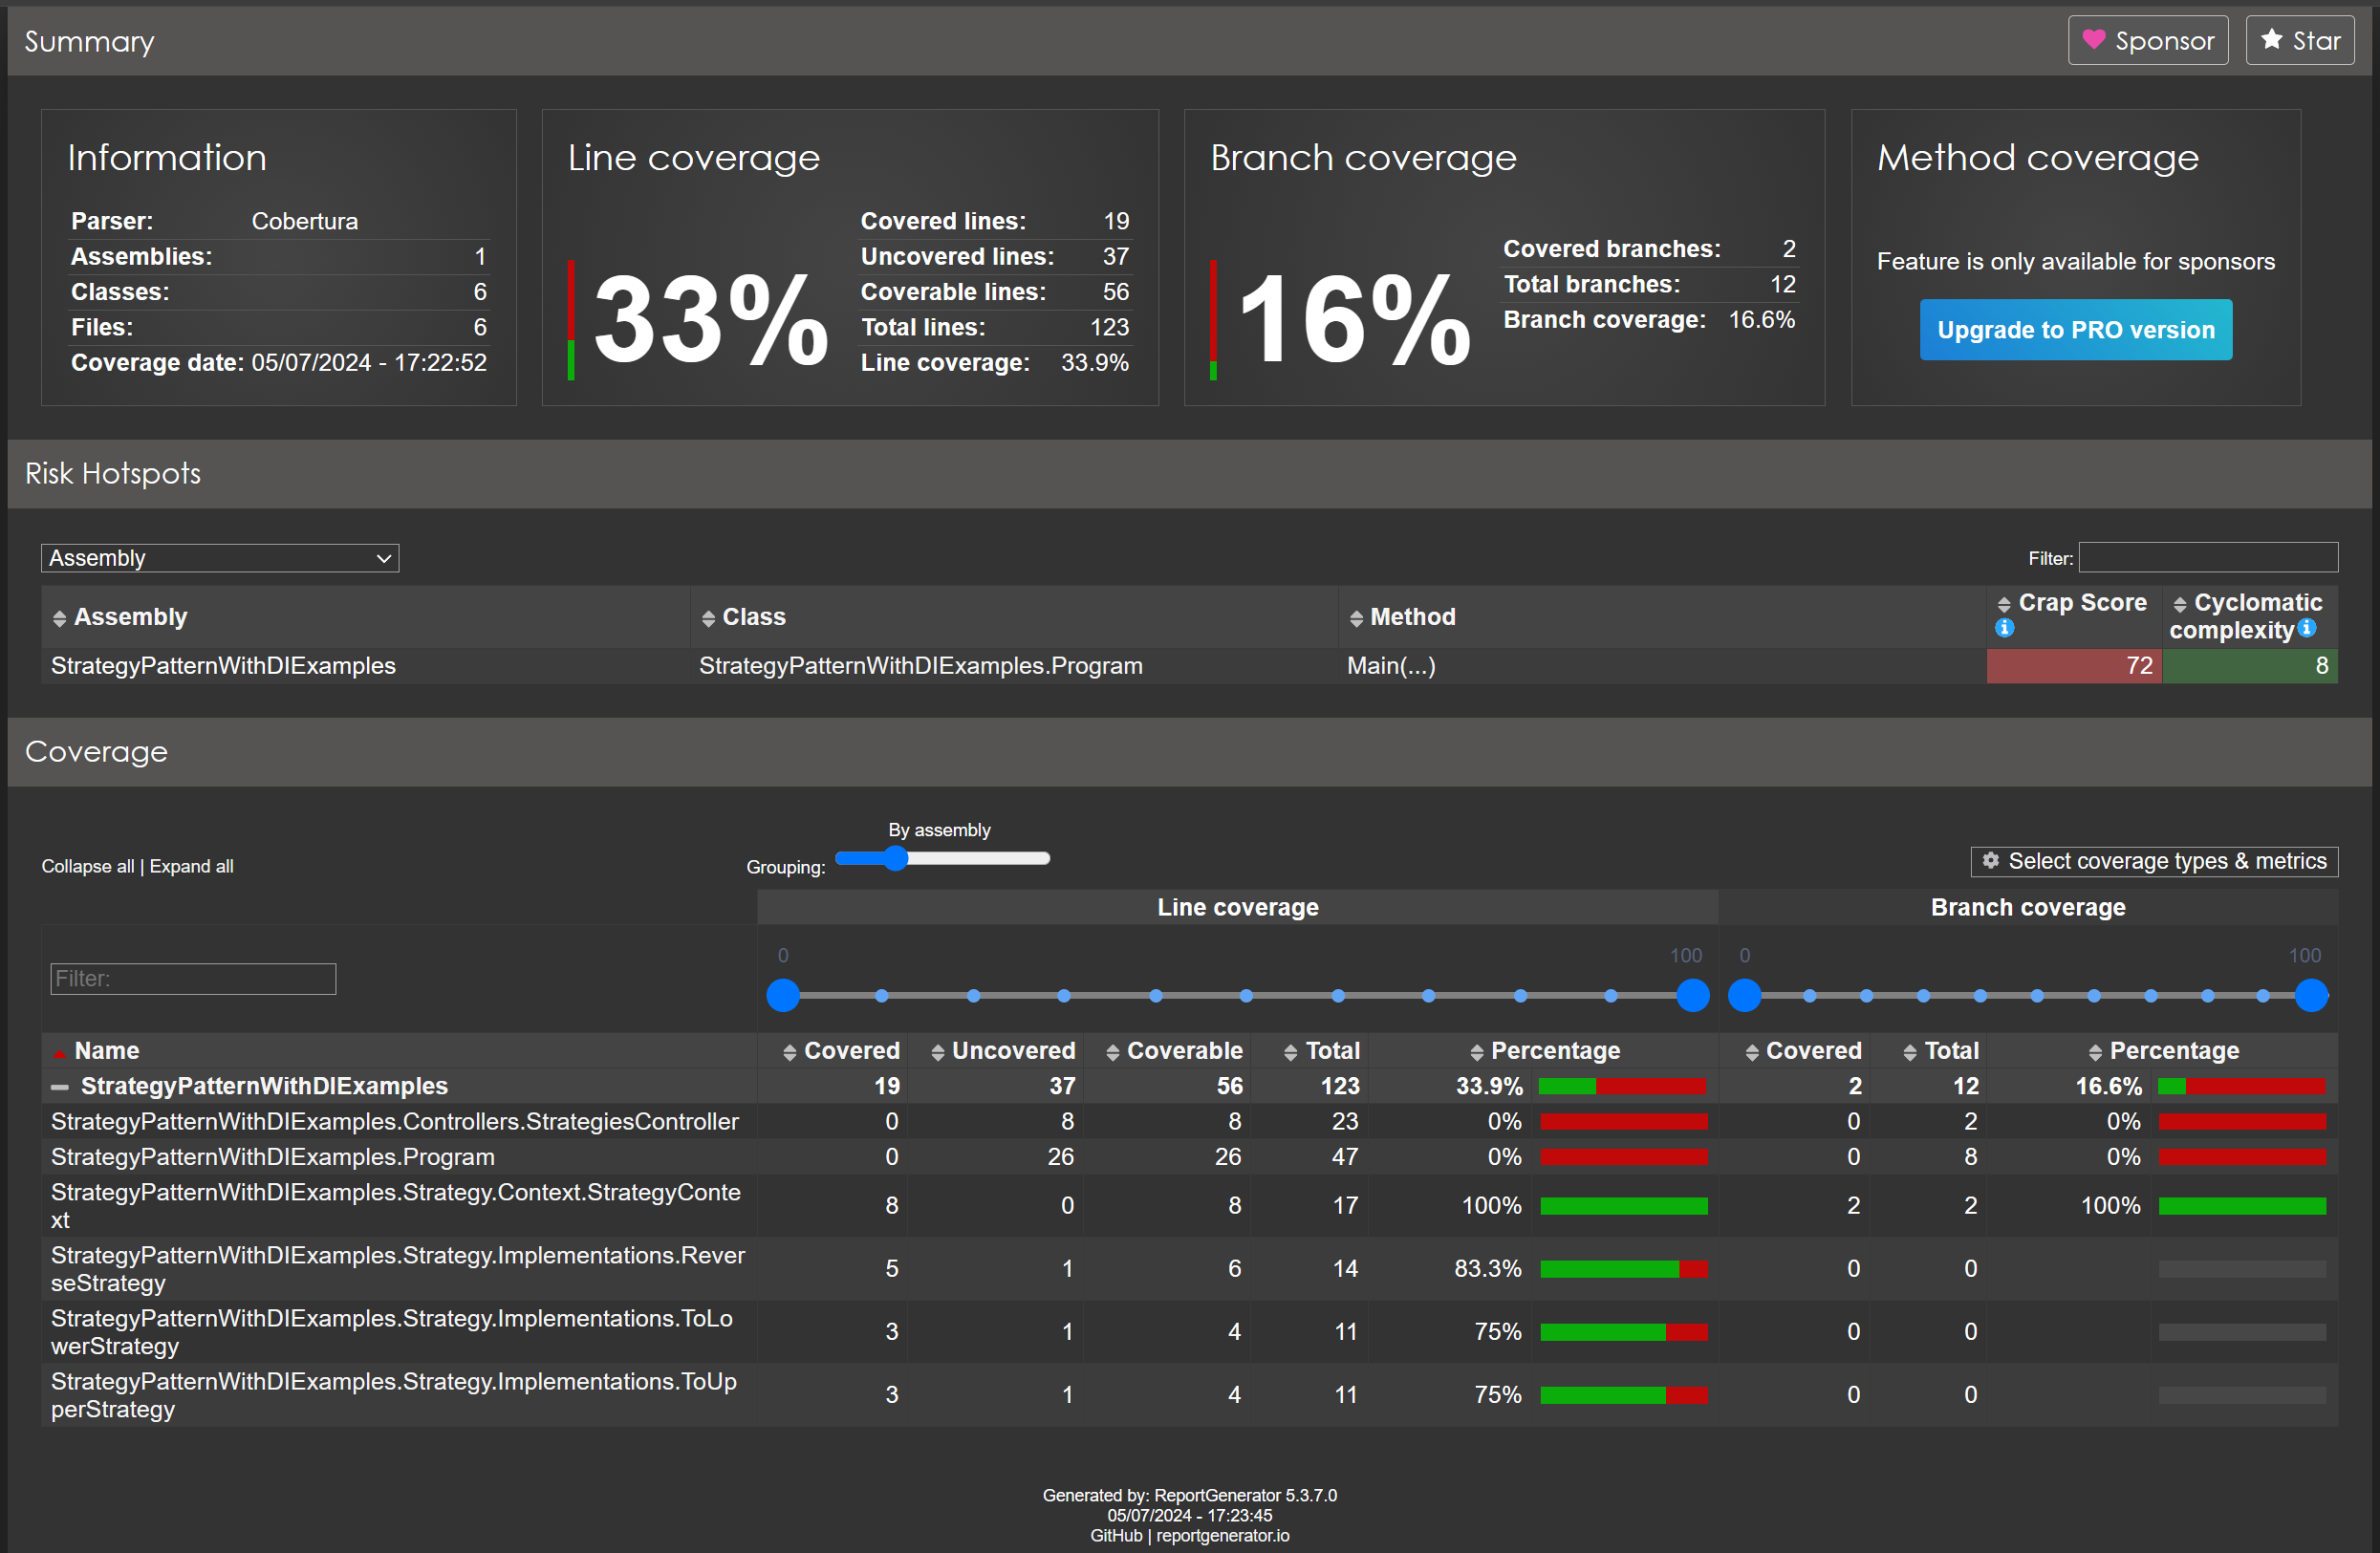
Now, we can generate the report without any problems using ReportGenerator.
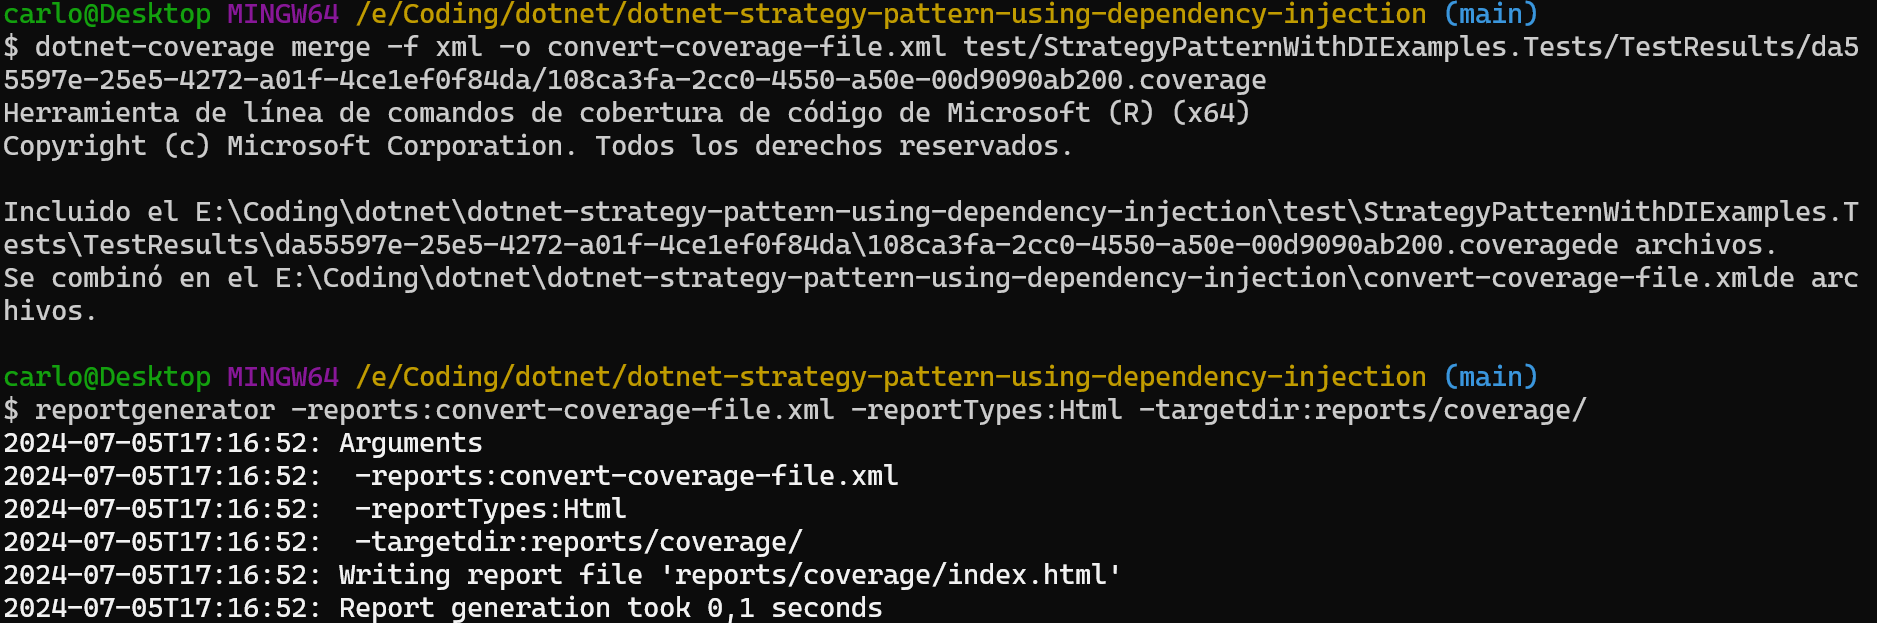
The next snapshot shows the result.

Generate a report from a Cobertura XML file
Generating a report from a Cobertura XML file is simpler than trying to create one from a .coverage file.
Simply run the following reportgeenerator commmand:
reportgenerator -reports:test/StrategyPatternWithDIExamples.Tests/TestResults/coverage.cobertura.xml -reportTypes:Html -targetdir:reports/cobertura/
You can see the generated report in the next screenshot.
Create a Code Coverage report when building a container image
In this section, I want to explore whether it is feasible to create a Code Coverage report inside a container using the various Data Collector we have discussed in the previous sections.
For this purpose, I have created the following Dockerfile, which collects Code Coverage metrics using the four Data Collector at the same time (coverlet, dotCover, dotnet-coverage and the native .NET collector).
FROM mcr.microsoft.com/dotnet/sdk:8.0-jammy AS build-env
WORKDIR /app

# Install dependencies for dotnet-coverage
RUN apt-get update && apt-get -y install \
     build-essential libxml2

# Install dotcover and dotnet-coverage
RUN dotnet tool install --global JetBrains.dotCover.CommandLineTools \
 && dotnet tool install --global dotnet-coverage

# Set the dotnet tools folder in the PATH env variable
ENV PATH="${PATH}:/root/.dotnet/tools"

# Copy everything
COPY . ./

# Restore packages
RUN dotnet restore -s "https://api.nuget.org/v3/index.json" \
	--arch x64

# Build project
RUN dotnet build "./src/StrategyPatternWithDIExamples.csproj" \
    --configuration Release \
	--self-contained true \
	--arch x64

# Create code coverage report with dotcover
RUN dotnet-dotCover cover-dotnet \
  --output=/app/coverage/dotcover/coverage.html \
  --reporttype=HTML -- test "./test/StrategyPatternWithDIExamples.Tests/StrategyPatternWithDIExamples.Tests.csproj"

# Create code coverage report with dotnet-coverage
RUN dotnet-coverage collect "dotnet test ./test/StrategyPatternWithDIExamples.Tests/StrategyPatternWithDIExamples.Tests.csproj" \
  -f xml \
  -o "/app/coverage/dotnetcoverage/coverage.xml"

# Create  code coverage report with native collector
RUN dotnet test "./test/StrategyPatternWithDIExamples.Tests/StrategyPatternWithDIExamples.Tests.csproj" \
	--no-restore \
	--collect:"Code Coverage" \
	--results-directory /app/coverage/native

# Create code coverage report with coverlet
RUN dotnet test "./test/StrategyPatternWithDIExamples.Tests/StrategyPatternWithDIExamples.Tests.csproj" \
	--no-restore \
	--collect:"XPlat Code Coverage" \
	--results-directory /app/coverage/coverlet

# Publish app
RUN dotnet publish "./src/StrategyPatternWithDIExamples.csproj" \
	--configuration Release \
	--output /app/publish \
	--self-contained true \
	--arch x64

# Build runtime image
FROM mcr.microsoft.com/dotnet/runtime-deps:8.0.0-jammy

# Copy artifact
WORKDIR /app
COPY --from=build-env /app/publish .
COPY --from=build-env /app/coverage /app/coverage

# Starts on port 8080
ENV ASPNETCORE_URLS=http://+:8080

# Set Entrypoint
ENTRYPOINT ["./StrategyPatternWithDIExamples"]
There are some important points to mention from this experiment:
- The
dotnet-coveragetool doesn’t work right out of the box. If we look at the Dockerfile logs, we can see the following message when trying to collect Code Coverage with thedotnet-coveragetool.
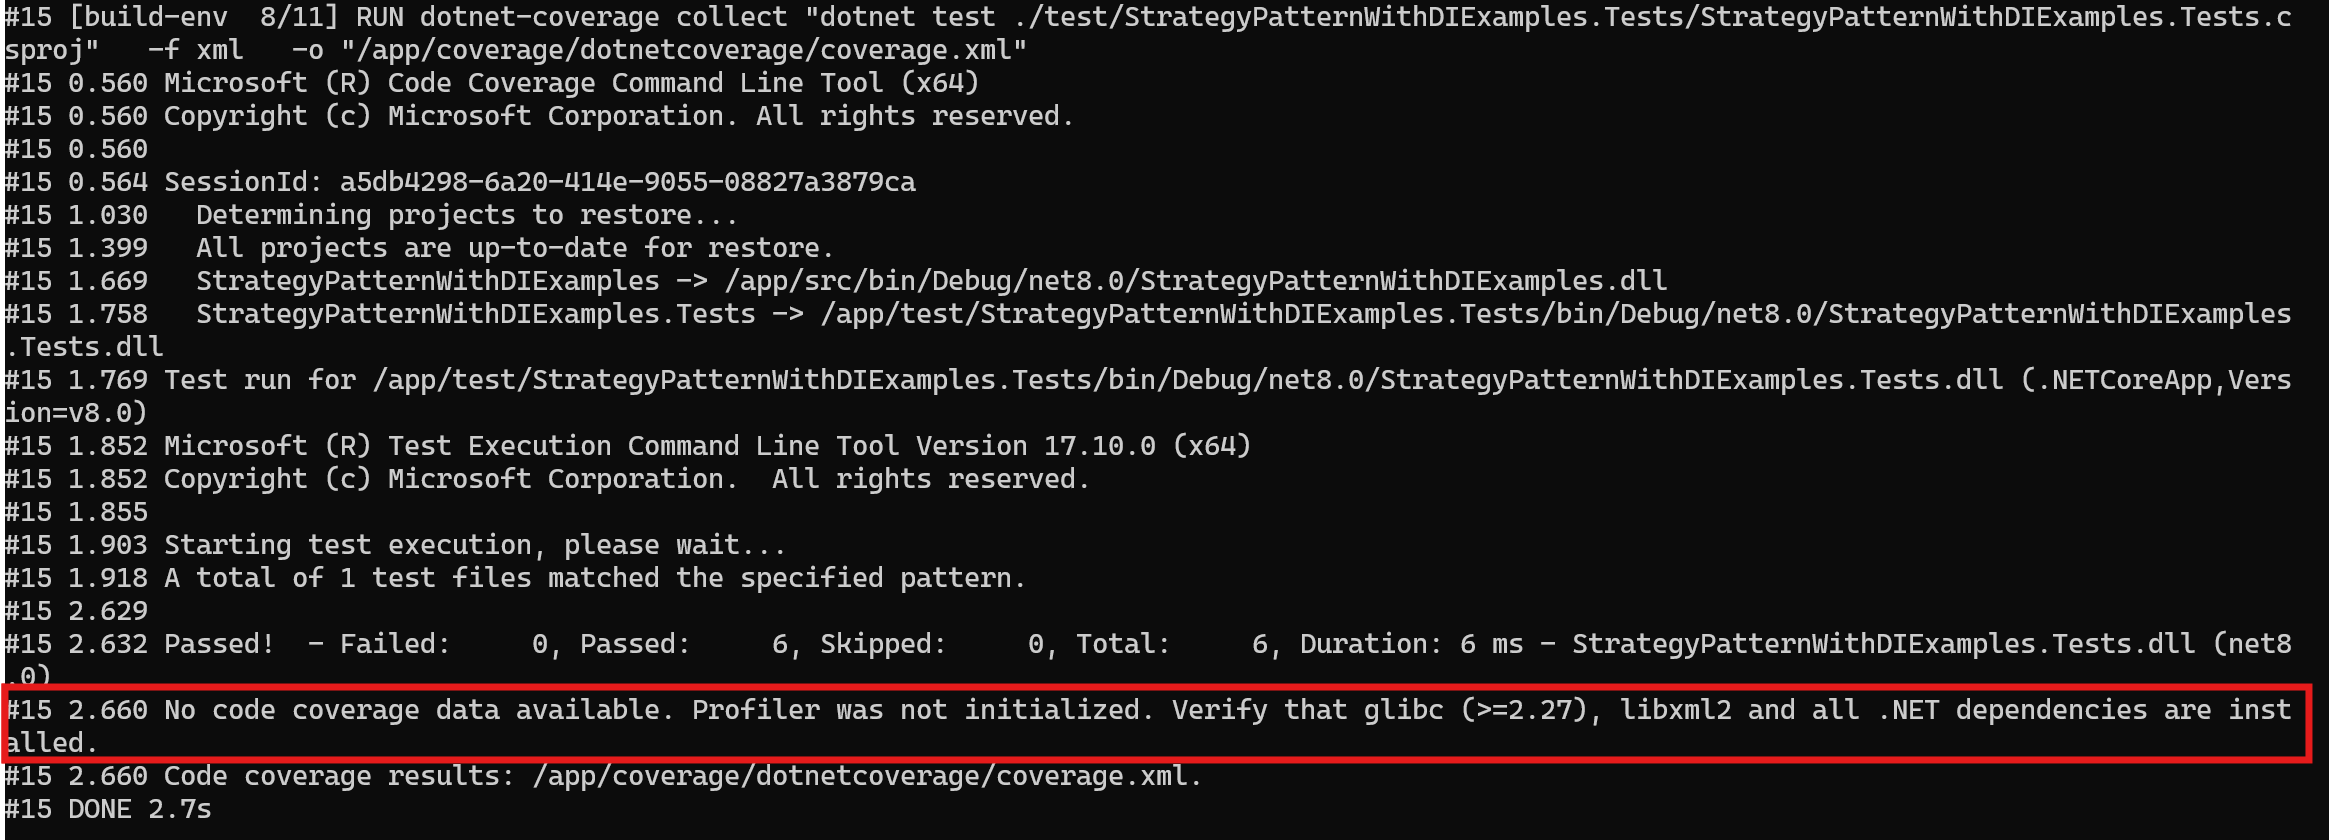
To fix this, we must install the following dependencies:
RUN apt-get update && apt-get -y install build-essential libxml2
- The
dotCoveralso gave me some problems when running it using thedotnet dotcover cover-dotnetcommand. To fix this, I switch to thedotnet-dotCover cover-dotnetcommand.
After addressing the issues mentioned above, all four Data Collector (coverlet, dotCover, dotnet-coverage and native .NET collector) successfully created a Code Coverage report inside the container image."
View Code Coverage reports on SonarQube
Having a centralized place to track the Code Coverage metric of your application provides several benefits, such as offering a detailed view of your code quality and helping you identify areas of your code that need improvement.
By uploading your Code Coverage metric, you can easily track which parts of your code are not covered by tests. This can help you improve your test coverage and, consequently, the reliability of your application.
There are quite a few products capable of tracking your .NET application Code Coverage metric, such as CodeCov and Codacy. However, I will focus on probably the most well-known of all: SonarQube.
SonarQube does not generate the Code Coverage report itself. Instead, you must set up a third-party tool (SonarScanner) to produce the report as part of your build process. SonarQube supports the following Data Collectors:
- Visual Studio Code Coverage
- dotnet-coverage Code Coverage
- dotCover
- OpenCover
- Coverlet
You then need to configure your analysis to tell the SonarScanner where the report is located so that it can pick it up and send it to SonarQube, where it will be displayed on your project dashboard along with other analysis metrics.
The process to send Code Coverage to SonarQube is quite simple:
- Generate the Code Coverage report using one of the Data Collectors we discussed in the previous sections
- Use the SonarScanner tool to upload it to SonarQube.
The SonarScanner for .NET comes in four major variants: .NET Framework, .NET Core, .NET Global Tool, and the Azure Pipelines extension.
For a quick test, I’m going to spin up a SonarQube instance in a local container and use the SonarScanner .NET Global tool.
To install the SonarScanner global tool, just run the following command:
dotnet tool install --global dotnet-sonarscanner
To generate the Code Coverage report, I have decided to use dotCover (but you could use any of the others Data Collectors, and it will work exactly the same).
dotnet sonarscanner begin /k:"code-coverage-test"
    /d:sonar.host.url="http://localhost:9000"
    /d:sonar.token="sqp_f040a45634b38c269223852b47d6500d3650c33d"
    /d:sonar.cs.dotcover.reportsPaths=coverage.html

dotnet dotcover cover-dotnet --output=coverage.html --reporttype=HTML -- test ./test/StrategyPatternWithDIExamples.Tests/StrategyPatternWithDIExamples.Tests.csproj

dotnet sonarscanner end /d:sonar.login="sqp_f040a45634b38c269223852b47d6500d3650c33d"
The process to send Code Coverage to SonarQube is pretty simple:
- Start the SonarScanner, setting the
sonar.cs.dotcover.reportsPathsproperty to where the Code Coverage report will be. - Run
dotCover. - Stop the SonarScanner.
If you browse your instance of SonarQube, you will find that the Code Coverage has been successfully uploaded.
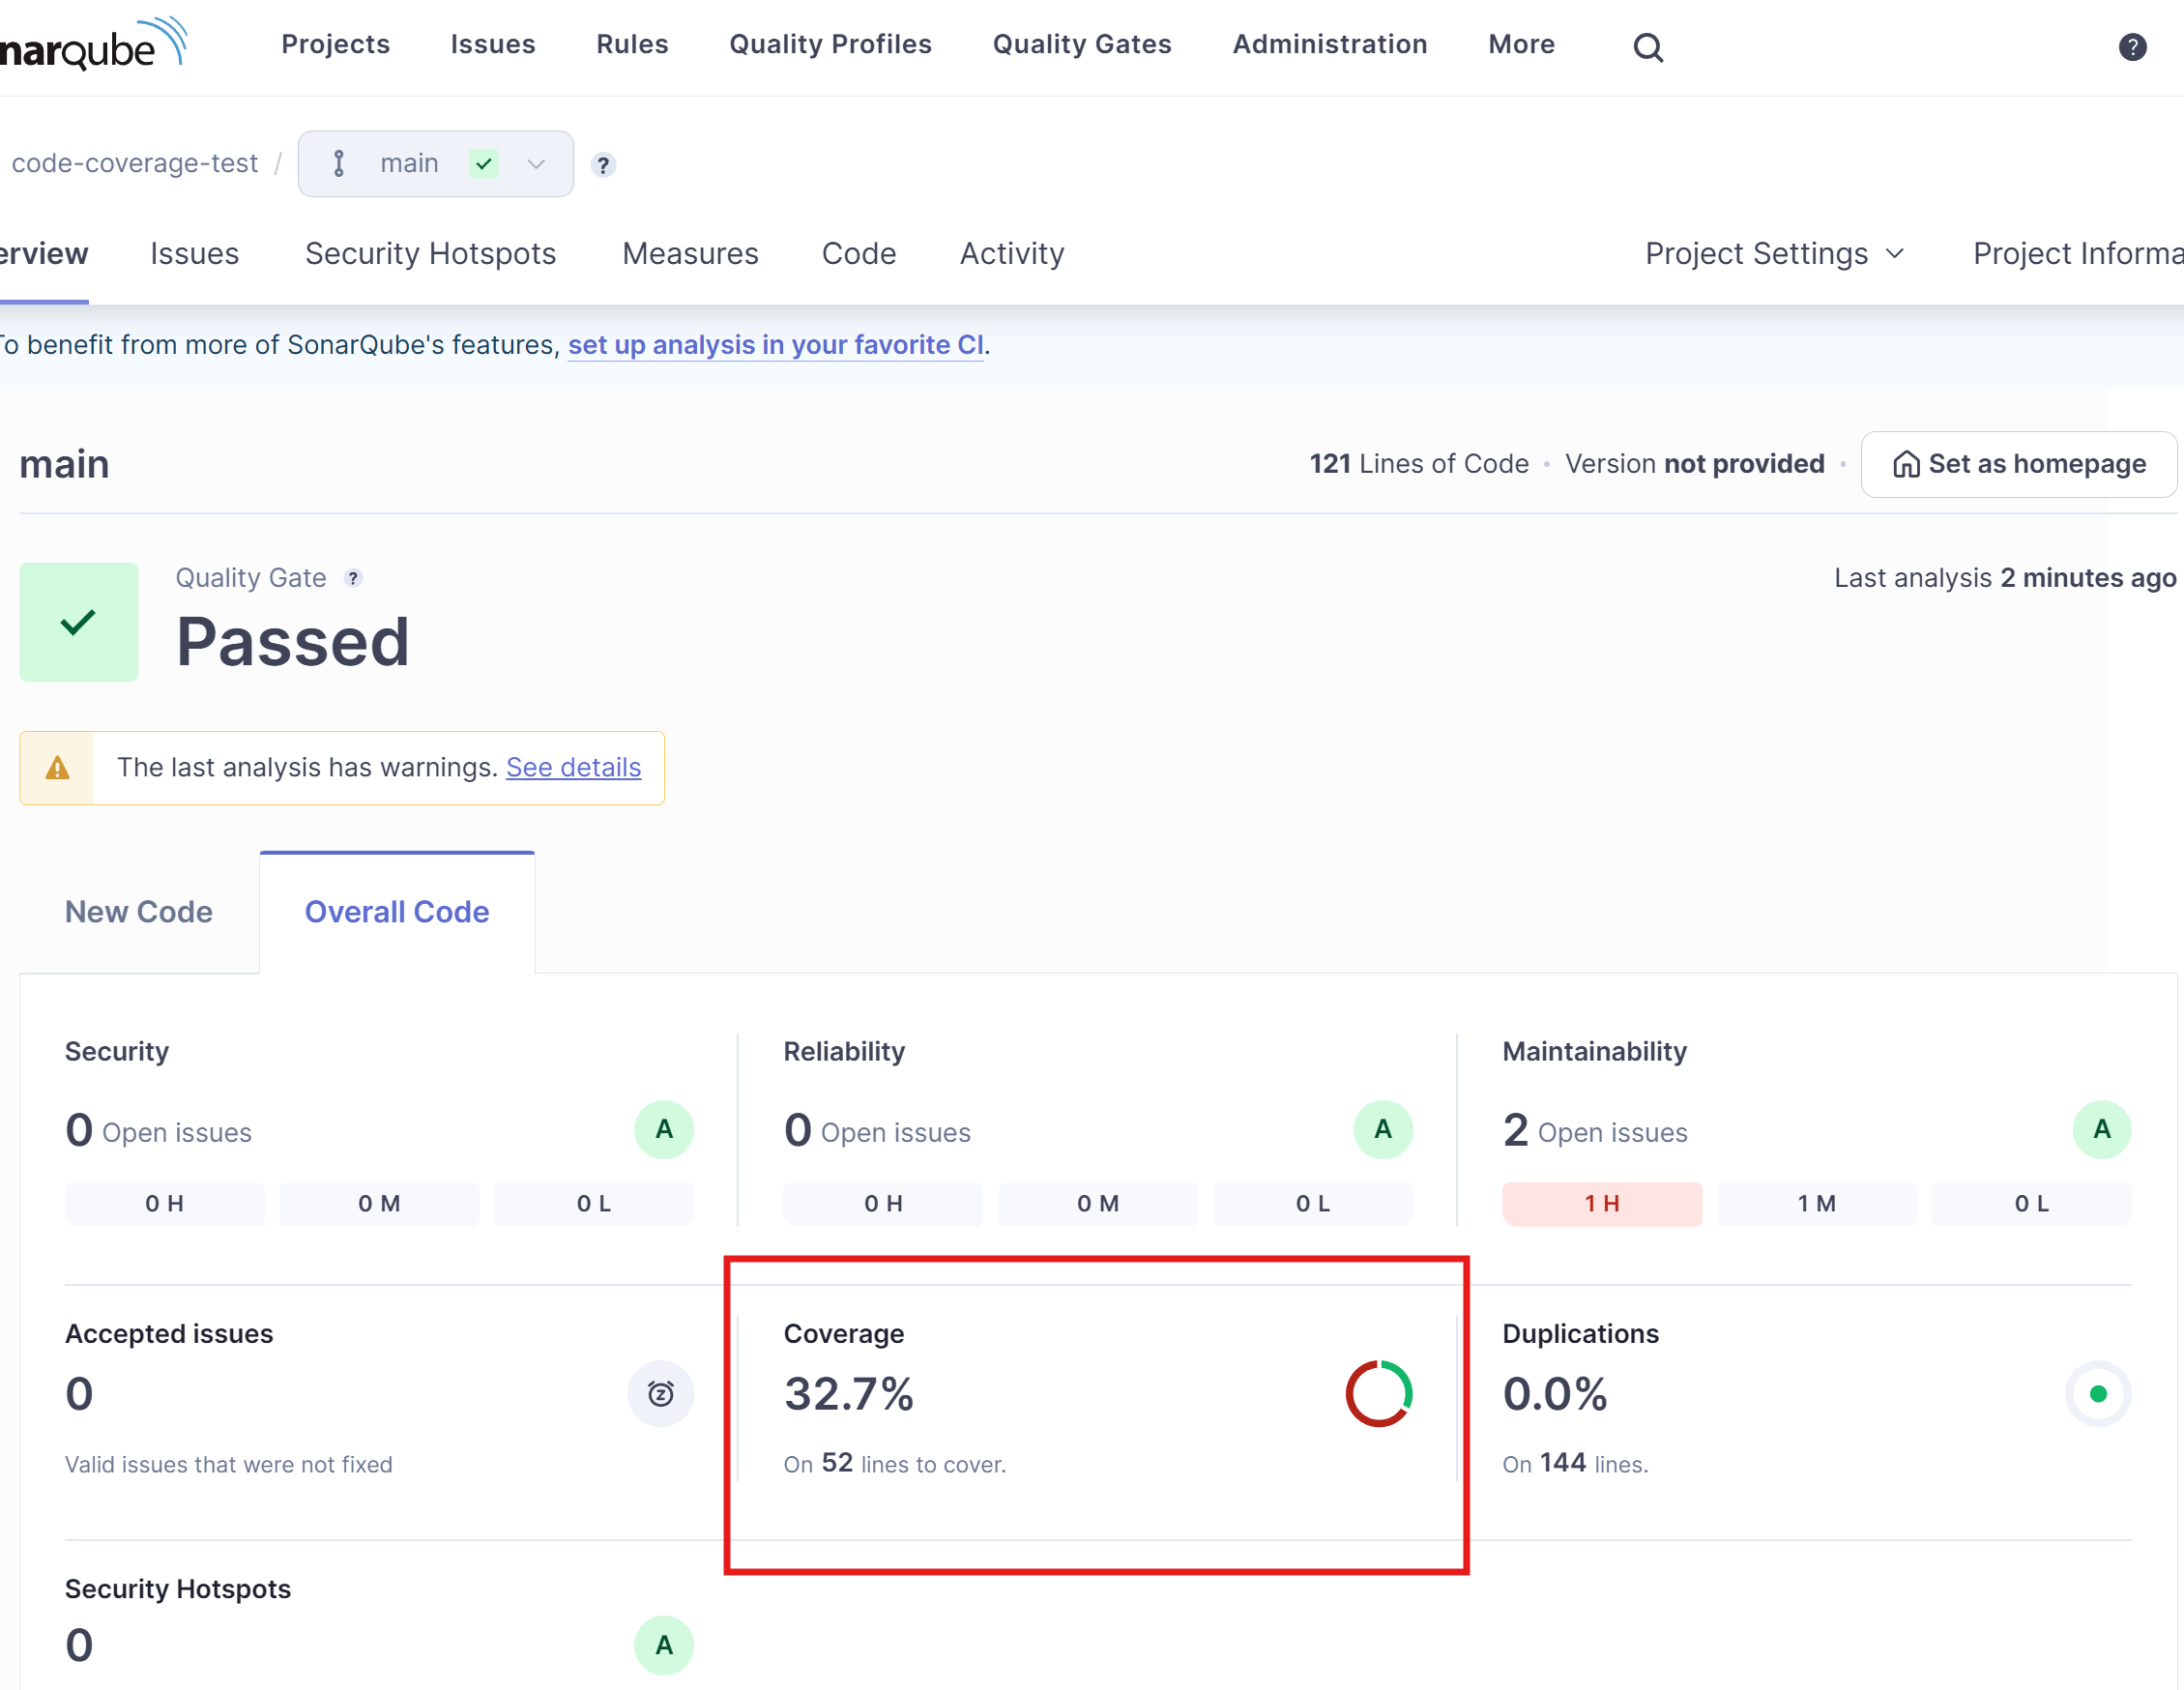
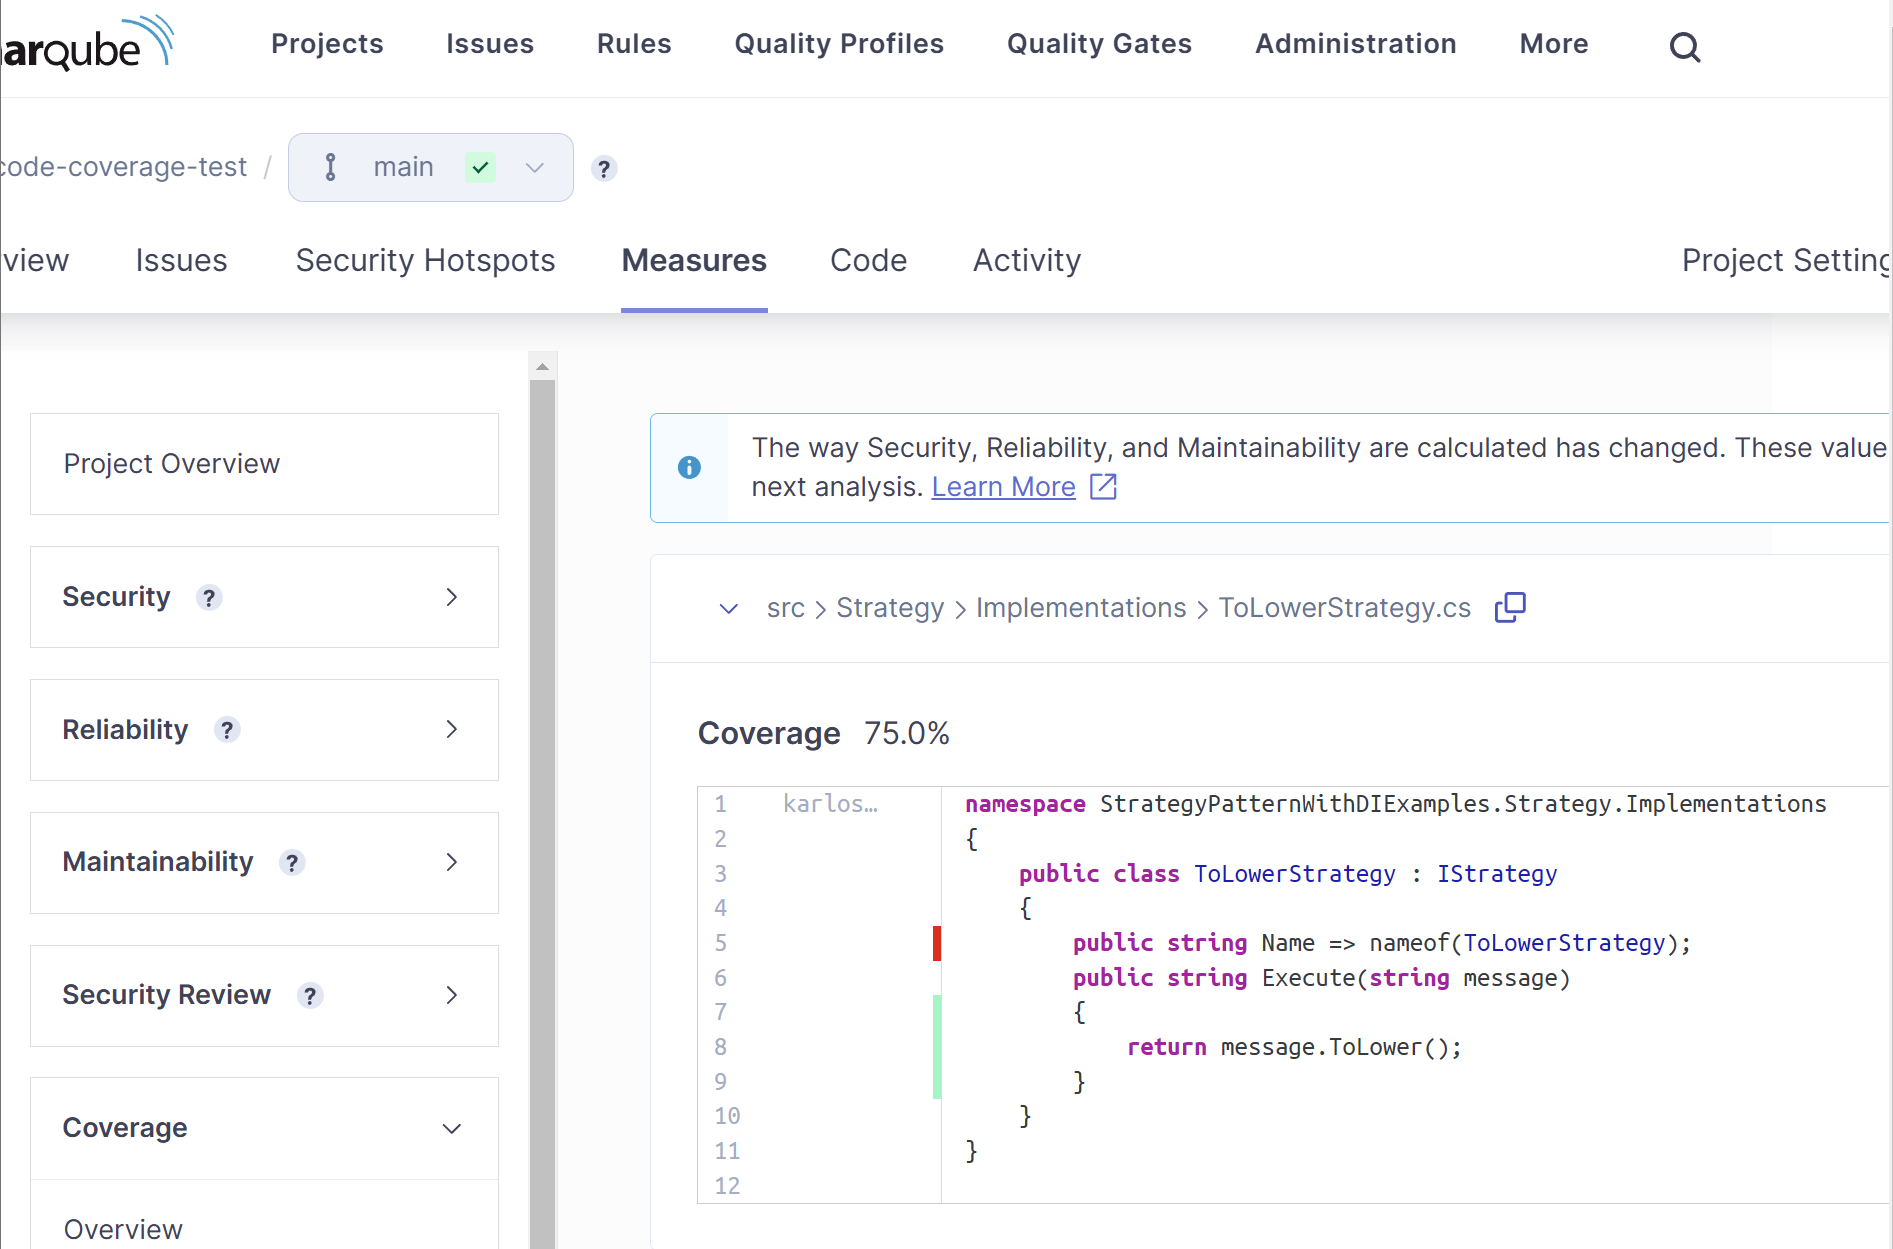
From there, we can drill down and get more detailed information about the Code Coverage metrics.
Publish Code Coverage reports to an Azure Pipelines or an Github Action
If you’re running your code on a CI runner like Azure Pipelines or GitHub Actions, you can use a tool like SonarQube to control the Code Coverage metric.
On your CI/CD pipeline, you can execute the SonarScanner, generate the Code Coverage report of your app, upload it into SonarQube (or any other SaaS that supports it), and, for example, break the pipeline if the Code Coverage percentage has decreased.
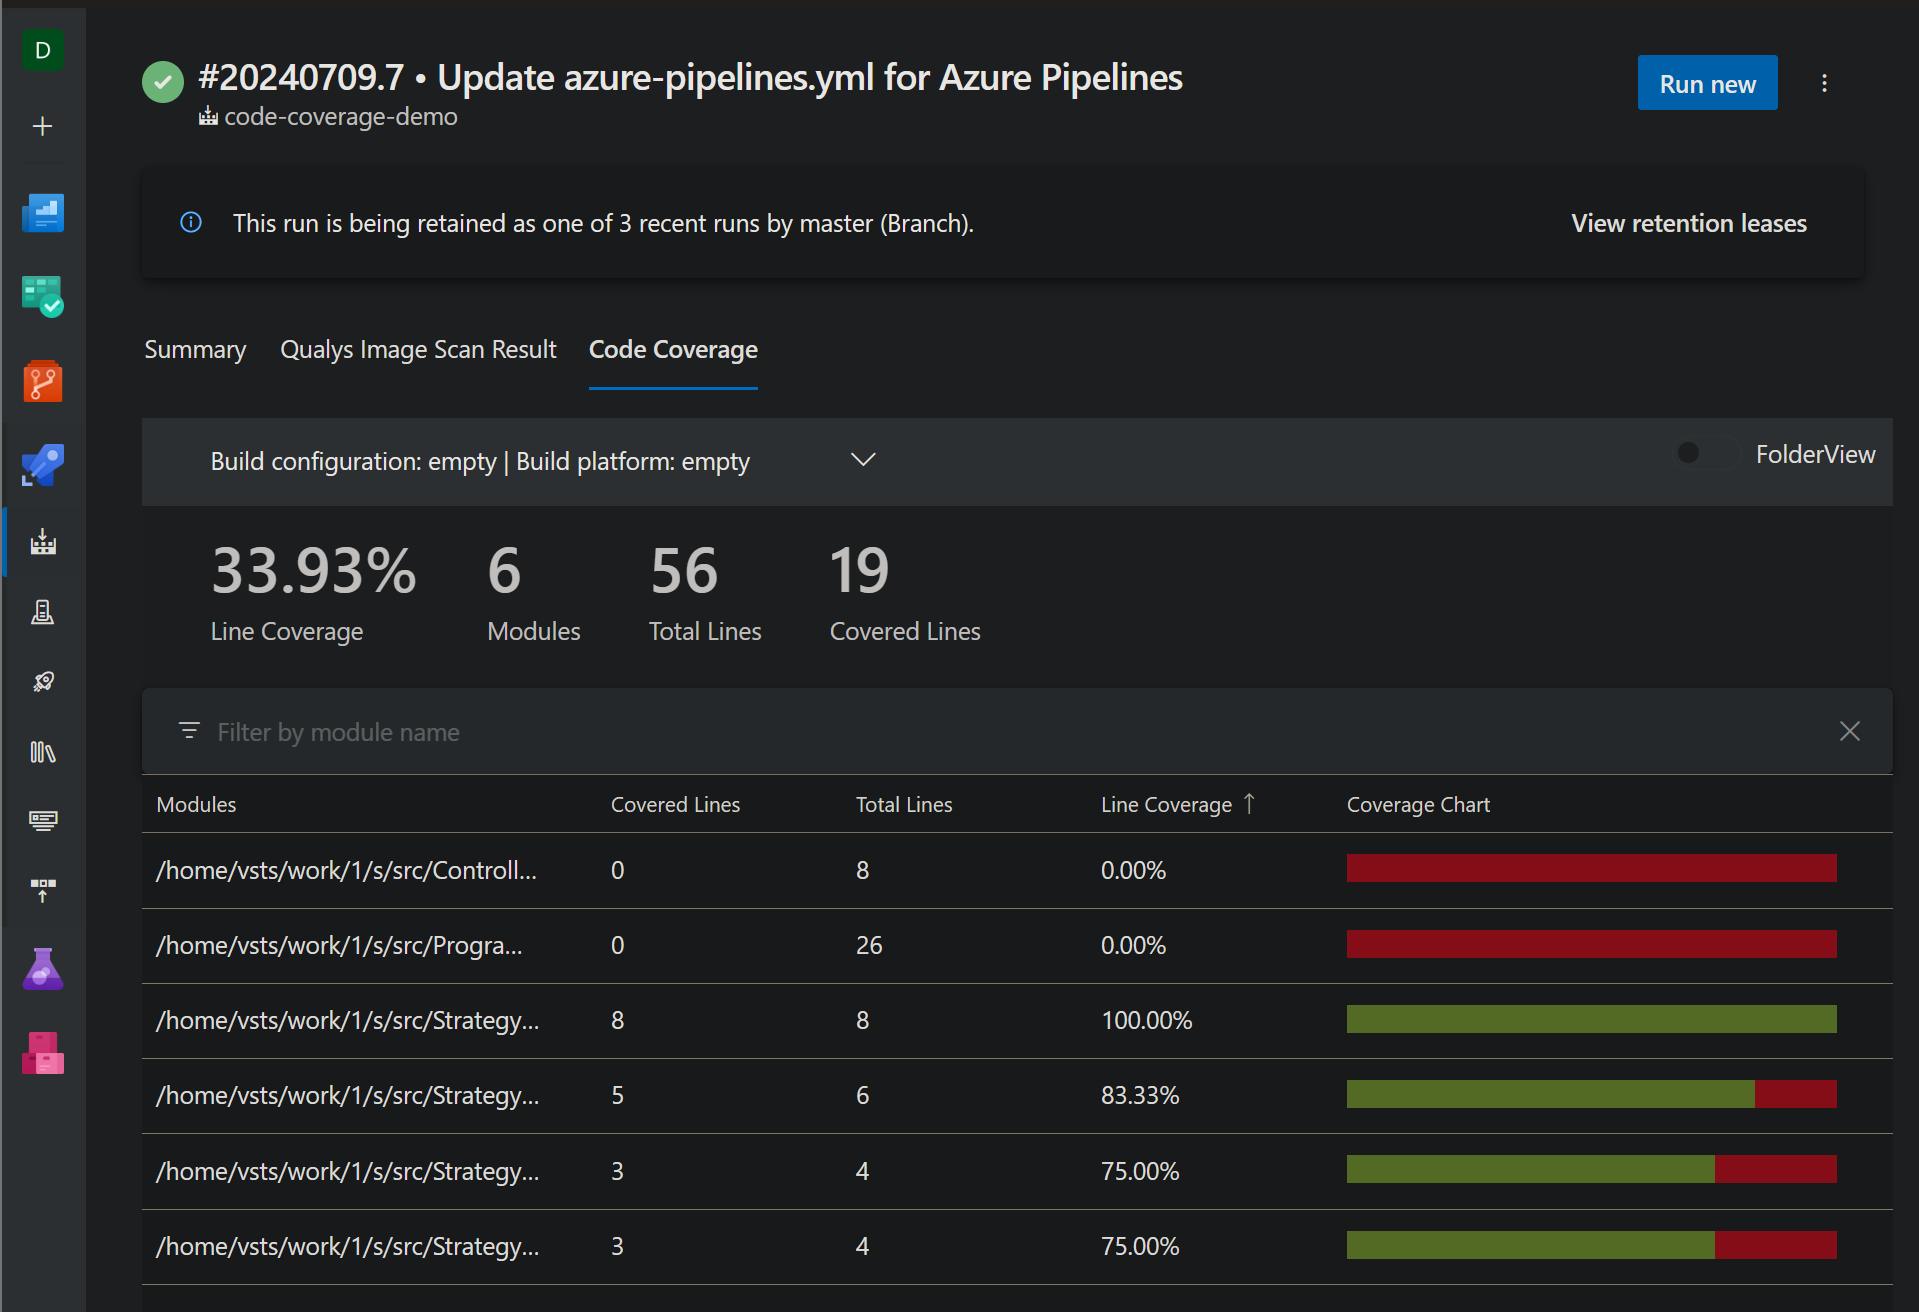
That’s a common scenario in a CI/CD project, but another possibility is to directly upload the Code Coverage report into the pipeline summary.
While having the report on the pipeline is not as useful as having a SaaS like SonarQube that can keep track of the Code Coverage for every branch, it can still be useful information if you want to quickly check the Code Coverage value of a specific run of the pipeline.
In this section, I’m going to show you how to upload the Code Coverage report into an Azure Pipeline and also into a GitHub Action.
Publish a Code Coverage report into a GitHub Action job
name: Upload Code Coverage report to github action summary

on:
  push:
    branches: [ main ]
  workflow_dispatch:

jobs:
  build:
    runs-on: ubuntu-latest

    steps:
      - uses: actions/checkout@v2
        with:
          submodules: true
          fetch-depth: 1

      - name: Test
        run: dotnet test --collect:"XPlat Code Coverage" --results-directory coverage

      - name: Code Coverage Summary Report
        uses: irongut/CodeCoverageSummary@v1.3.0
        with:
          filename: 'coverage/*/coverage.cobertura.xml'
          badge: true
          format: 'markdown'
          output: 'both'

      - name: Write to Job Summary
        run: cat code-coverage-results.md >> $GITHUB_STEP_SUMMARY
As you can see, the steps to collect Code Coverage are always exactly the same. First, run dotnet test with a Data Collector; in this case, we’re using Coverlet.
Then, use another tool to generate a human-readable report. In this case, we’re using this open-source github action to generate a summary of the Code Coverage report.
Here’s how it looks.
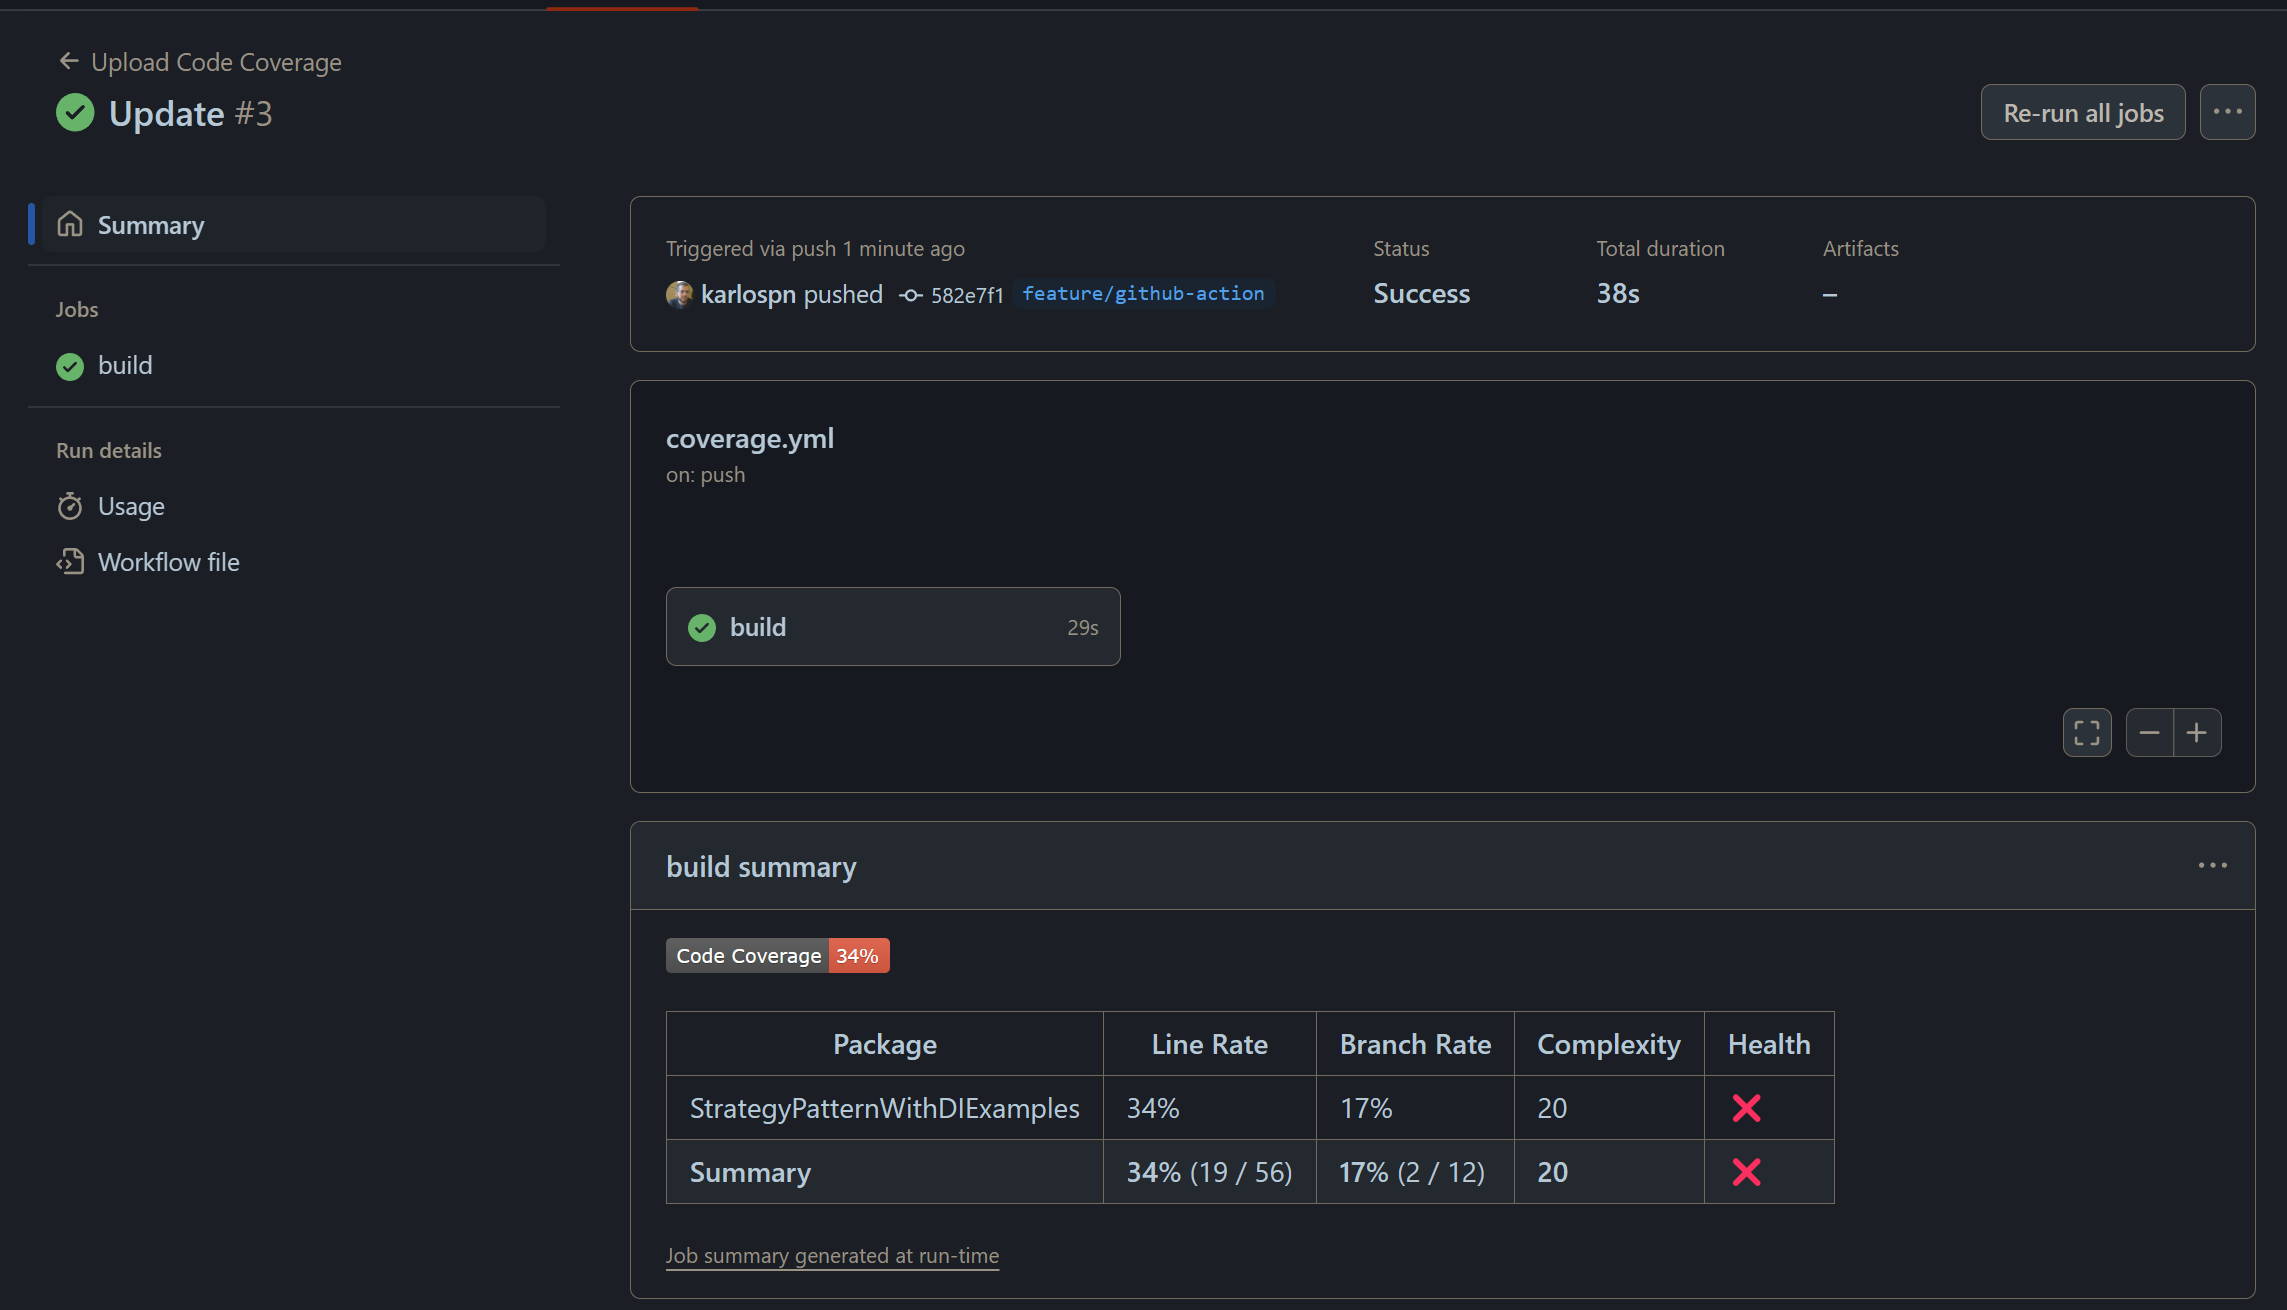
Obviously, if you prefer to use the ReportGenerator tool, as discussed previously in the post, to generate the summary, you can absolutely do so. ReportGenerator even has a type of report built for Github called MarkdownSummaryGithub
name: Upload Code Coverage report to github action summary

on:
  push:
    branches: [ main ]
  workflow_dispatch:

jobs:
  build:
    runs-on: ubuntu-latest

    steps:
      - uses: actions/checkout@v2
        with:
          submodules: true
          fetch-depth: 1

      - name: Test
        run: dotnet test --collect:"XPlat Code Coverage" --results-directory coverage

      - name: Code coverage report generator
        run: |
          dotnet tool install -g dotnet-reportgenerator-globaltool
          reportgenerator -reports:coverage/*/coverage.cobertura.xml -targetdir:report -reporttypes:'MarkdownSummaryGithub'

      - name: Write to Job Summary
        run: cat report/SummaryGithub.md >> $GITHUB_STEP_SUMMARY
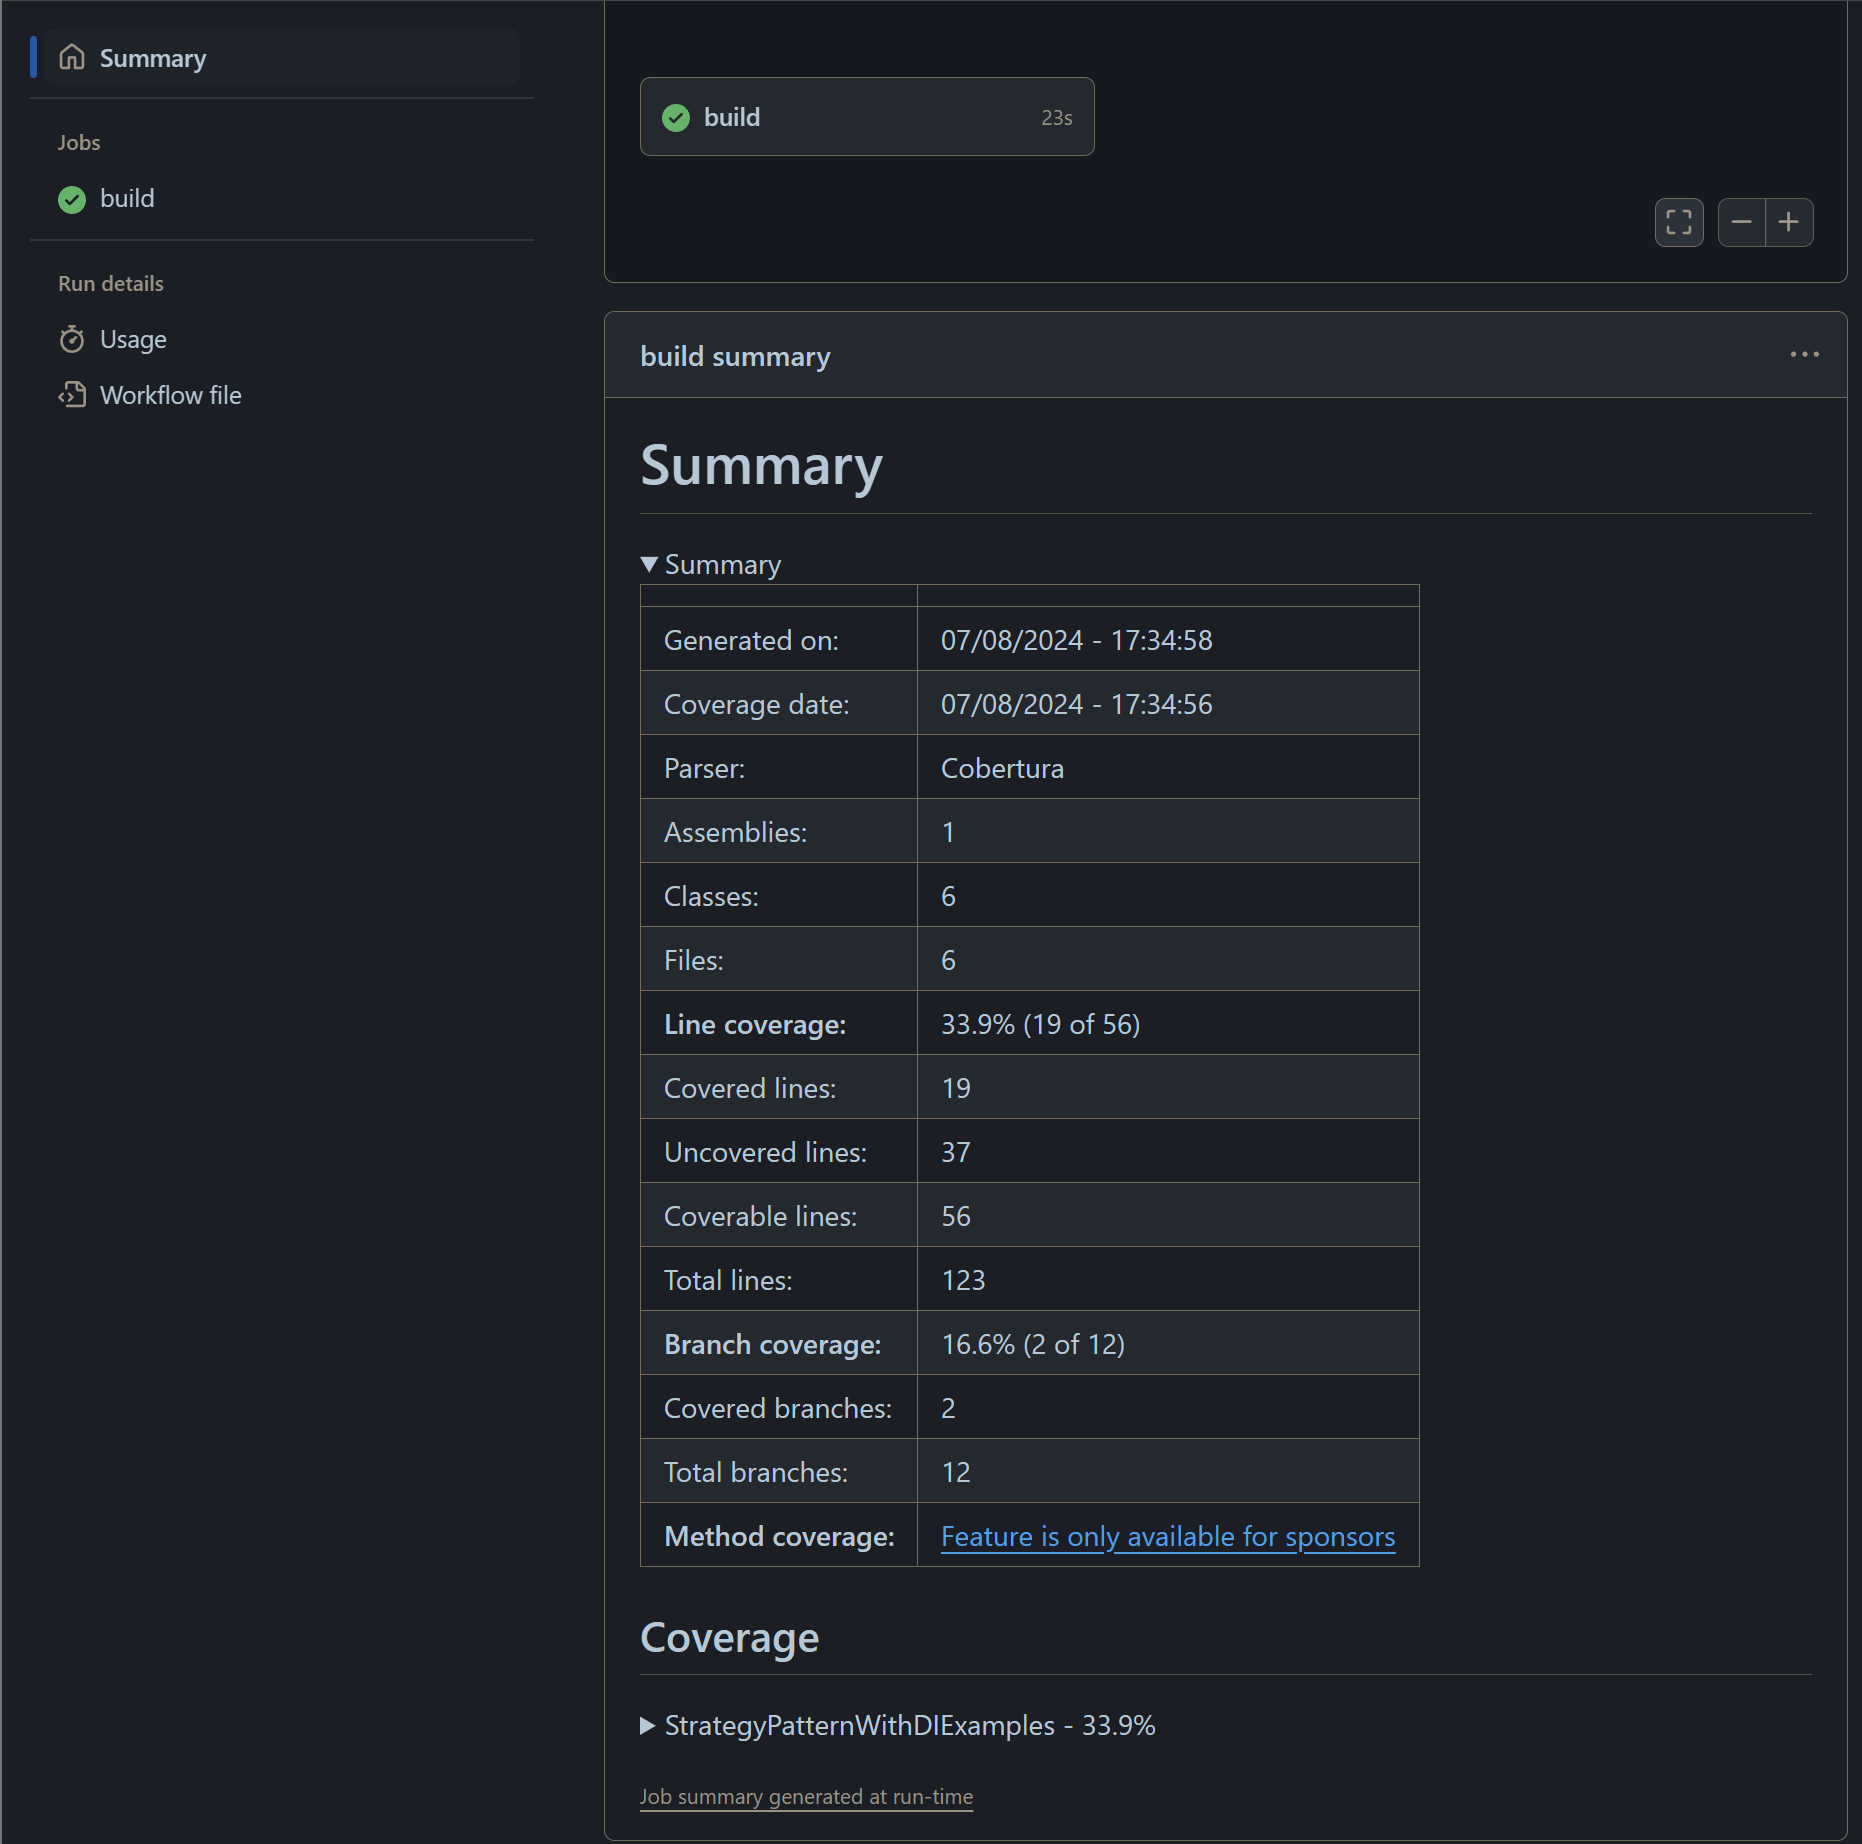
Here’s how it looks if we use ReportGenerator to create the Code Coverage report:
Publish a Code Coverage report into an Azure DevOps Pipeline
The steps are the same as those we followed for the Github Action. First, run dotnet test with a Code Coverage DataCollector, in this case, we’re using Coverlet.
This time, instead of using the ReportGenerator .NET global tool, we’re using the official ReportGenerator Azure DevOps Task. Note that this task is not pre-installed in Azure DevOps; you need to install it from the Marketplace:
Once we’ve generated the report, we simply need to publish it into the running pipeline.
trigger: none

pool:
  vmImage: ubuntu-latest

steps:
- task: Bash@3
  displayName: 'Collect code coverage'
  inputs:
    targetType: 'inline'
    script: 'dotnet test --collect:"XPlat Code Coverage" --results-directory coverage'
    workingDirectory: '$(System.DefaultWorkingDirectory)'

- task: reportgenerator@5
  inputs:
    reports: '$(System.DefaultWorkingDirectory)/**/coverage.cobertura.xml'
    targetdir: '$(System.DefaultWorkingDirectory)/report'


- task: PublishCodeCoverageResults@2
  inputs:
    summaryFileLocation: '$(System.DefaultWorkingDirectory)/report/Cobertura.xml'
Here’s the end result: